Mapped: The Cost of Living in Every U.S. State (2026)
Key Takeaways
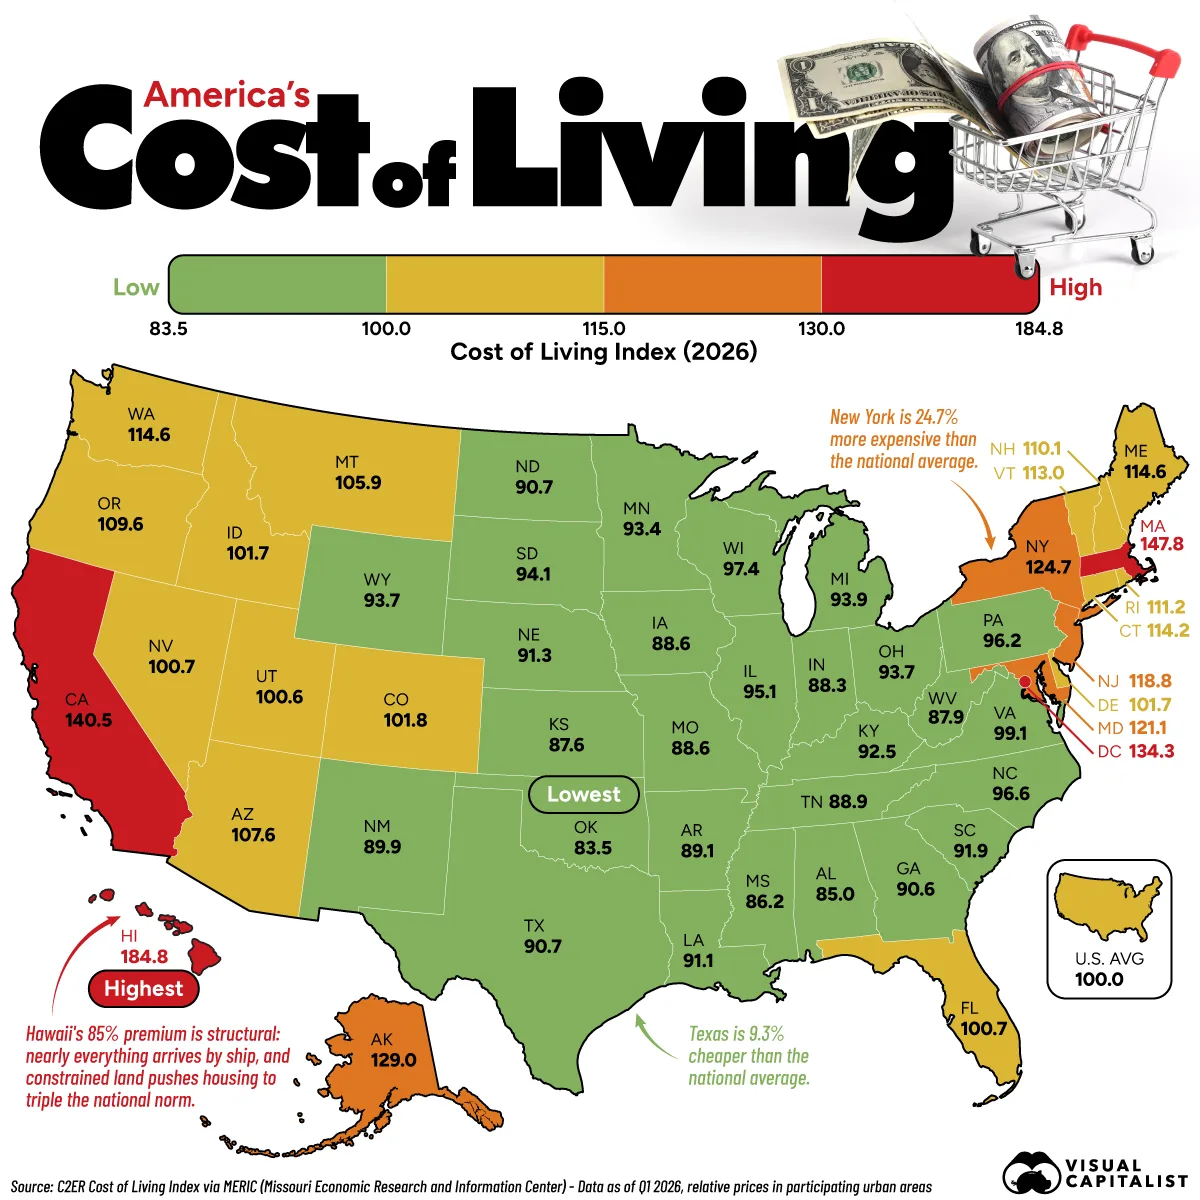
- Hawaii is America’s most expensive state, with living costs 84.8% above the national average, while Oklahoma is the cheapest at 16.5% below.
- Housing creates the widest cost gap between states, with the housing index ranging from 66.9 in Oklahoma to 302.4 in Hawaii.
Living costs vary significantly across the United States, with some states well above or below the national average.
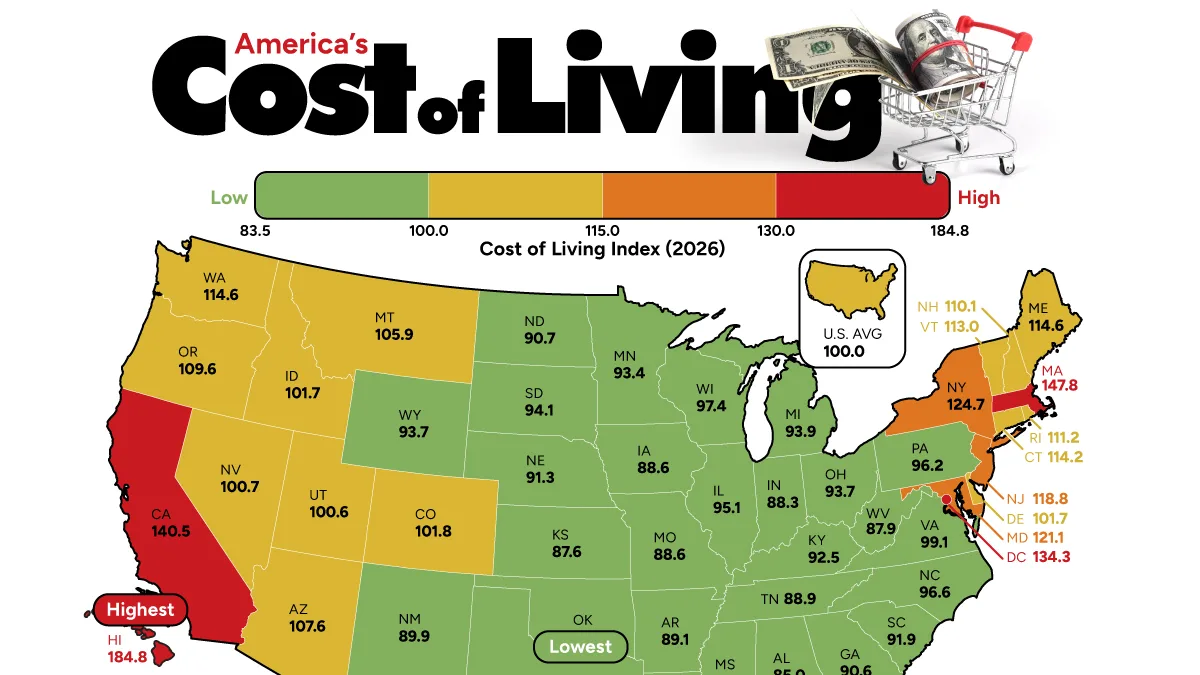
This map shows the overall cost of living index for all 50 states and Washington, D.C. in Q1 2026, using the C2ER Cost of Living Index published by the Missouri Economic Research and Information Center (MERIC).
The index measures relative prices for a household basket of goods and services in participating urban areas, with the U.S. average set at 100. It reflects prices, not incomes: a state at 120 is 20% more expensive than average, regardless of what its residents earn.
The Cost of Living in the U.S., State by State
The gap between America’s most and least expensive states is striking: Hawaii’s cost of living index is more than twice Oklahoma’s.
Hawaii tops the ranking at 184.8, meaning living costs are nearly 85% above the national average. Housing is the biggest contributor, with the state’s housing index reaching 302.4.
The table below shows the cost of living index for every state in Q1 2026, along with how far each sits above or below the U.S. average:
| Rank | State | Cost of Living Index (U.S. = 100) | vs. U.S. Avg. |
|---|---|---|---|
| 1 | Hawaii | 184.8 | +84.8% |
| 2 | Massachusetts | 147.8 | +47.8% |
| 3 | California | 140.5 | +40.5% |
| 4 | District of Columbia | 134.3 | +34.3% |
| 5 | Alaska | 129.0 | +29.0% |
| 6 | New York | 124.7 | +24.7% |
| 7 | Maryland | 121.1 | +21.1% |
| 8 | New Jersey | 118.8 | +18.8% |
| 9 | Washington | 114.6 | +14.6% |
| 10 | Maine | 114.6 | +14.6% |
| 11 | Connecticut | 114.2 | +14.2% |
| 12 | Vermont | 113.0 | +13.0% |
| 13 | Rhode Island | 111.2 | +11.2% |
| 14 | New Hampshire | 110.1 | +10.1% |
| 15 | Oregon | 109.6 | +9.6% |
| 16 | Arizona | 107.6 | +7.6% |
| 17 | Montana | 105.9 | +5.9% |
| 18 | Colorado | 101.8 | +1.8% |
| 19 | Delaware | 101.7 | +1.7% |
| 19 | Idaho | 101.7 | +1.7% |
| 21 | Florida | 100.7 | +0.7% |
| 21 | Nevada | 100.7 | +0.7% |
| 23 | Utah | 100.6 | +0.6% |
| 24 | Virginia | 99.1 | -0.9% |
| 25 | Wisconsin | 97.4 | -2.6% |
| 26 | North Carolina | 96.6 | -3.4% |
| 27 | Pennsylvania | 96.2 | -3.8% |
| 28 | Illinois | 95.1 | -4.9% |
| 29 | South Dakota | 94.1 | -5.9% |
| 30 | Michigan | 93.9 | -6.1% |
| 31 | Ohio | 93.7 | -6.3% |
| 32 | Wyoming | 93.7 | -6.3% |
| 33 | Minnesota | 93.4 | -6.6% |
| 34 | Kentucky | 92.5 | -7.5% |
| 35 | South Carolina | 91.9 | -8.1% |
| 36 | Nebraska | 91.3 | -8.7% |
| 37 | Louisiana | 91.1 | -8.9% |
| 38 | North Dakota | 90.7 | -9.3% |
| 39 | Texas | 90.7 | -9.3% |
| 40 | Georgia | 90.6 | -9.4% |
| 41 | New Mexico | 89.9 | -10.1% |
| 42 | Arkansas | 89.1 | -10.9% |
| 43 | Tennessee | 88.9 | -11.1% |
| 44 | Iowa | 88.6 | -11.4% |
| 44 | Missouri | 88.6 | -11.4% |
| 46 | Indiana | 88.3 | -11.7% |
| 47 | West Virginia | 87.9 | -12.1% |
| 48 | Kansas | 87.6 | -12.4% |
| 49 | Mississippi | 86.2 | -13.8% |
| 50 | Alabama | 85.0 | -15.0% |
| 51 | Oklahoma | 83.5 | -16.5% |
Massachusetts (147.8) and California (140.5) follow Hawaii, with Washington, D.C. (134.3) and Alaska (129.0) rounding out the top five. These are the same five jurisdictions that led the 2025 edition of this ranking.
New York, at 124.7, is 24.7% more expensive than the national average, while Texas is the outlier among the four largest states. At 90.7, it is 9.3% cheaper than the national average.
On the other end of the affordability scale, Oklahoma’s 83.5 makes it the cheapest state in America, with Alabama (85.0) and Mississippi (86.2) following and extending a Southern affordability belt.
Housing Drives the Biggest Differences in Cost of Living
Housing drives the biggest cost differences between states. Its index ranges from 66.9 in Oklahoma to 302.4 in Hawaii, a 4.5-fold gap. Grocery costs are much closer, with 45 of 51 jurisdictions within seven points of the national average.
The income needed to live comfortably in each state also tracks housing costs closely.
The table below shows how each state compares across all six C2ER spending categories:
| State | Cost of Living Index by Category, Q1 2026 (U.S. = 100) | ||||||
|---|---|---|---|---|---|---|---|
| Overall | Grocery | Housing | Utilities | Transportation | Health | Misc. | |
| Alabama | 85.0 | 95.0 | 67.7 | 96.9 | 88.8 | 85.6 | 91.8 |
| Alaska | 129.0 | 126.6 | 132.4 | 148.4 | 123.8 | 130.7 | 123.1 |
| Arizona | 107.6 | 99.6 | 119.0 | 102.1 | 103.5 | 98.8 | 104.9 |
| Arkansas | 89.1 | 93.4 | 77.2 | 98.3 | 88.8 | 85.8 | 95.7 |
| California | 140.5 | 110.5 | 189.5 | 134.6 | 142.0 | 111.1 | 116.0 |
| Colorado | 101.8 | 100.9 | 107.4 | 88.7 | 89.1 | 103.9 | 103.5 |
| Connecticut | 114.2 | 106.0 | 123.5 | 126.5 | 105.6 | 108.9 | 109.6 |
| Delaware | 101.7 | 103.6 | 101.3 | 97.5 | 99.6 | 101.6 | 102.9 |
| District of Columbia | 134.3 | 109.2 | 190.4 | 107.8 | 105.8 | 118.7 | 112.4 |
| Florida | 100.7 | 105.7 | 101.1 | 94.6 | 99.5 | 101.4 | 99.8 |
| Georgia | 90.6 | 96.9 | 77.6 | 98.6 | 96.3 | 99.6 | 94.3 |
| Hawaii | 184.8 | 136.3 | 302.4 | 183.5 | 149.0 | 113.1 | 122.7 |
| Idaho | 101.7 | 103.4 | 105.1 | 73.4 | 101.0 | 101.6 | 105.3 |
| Illinois | 95.1 | 99.2 | 84.7 | 102.6 | 97.0 | 103.0 | 98.9 |
| Indiana | 88.3 | 97.9 | 73.0 | 95.2 | 95.7 | 91.5 | 93.5 |
| Iowa | 88.6 | 96.6 | 75.6 | 88.6 | 93.7 | 94.3 | 94.5 |
| Kansas | 87.6 | 95.3 | 77.5 | 97.4 | 88.0 | 90.6 | 90.1 |
| Kentucky | 92.5 | 101.4 | 78.1 | 87.8 | 95.8 | 92.4 | 101.6 |
| Louisiana | 91.1 | 95.4 | 83.3 | 82.3 | 94.4 | 91.6 | 97.3 |
| Maine | 114.6 | 101.6 | 134.8 | 124.6 | 104.4 | 114.7 | 102.7 |
| Maryland | 121.1 | 109.3 | 149.1 | 113.2 | 106.3 | 106.9 | 109.5 |
| Massachusetts | 147.8 | 106.8 | 217.5 | 143.9 | 108.5 | 131.8 | 118.3 |
| Michigan | 93.9 | 100.1 | 85.7 | 98.0 | 98.5 | 88.2 | 97.0 |
| Minnesota | 93.4 | 98.8 | 79.5 | 95.4 | 93.6 | 111.5 | 100.0 |
| Mississippi | 86.2 | 93.2 | 71.0 | 94.4 | 89.8 | 85.1 | 93.7 |
| Missouri | 88.6 | 94.7 | 76.1 | 92.4 | 86.5 | 98.0 | 95.2 |
| Montana | 105.9 | 102.4 | 113.2 | 80.2 | 103.9 | 106.3 | 108.0 |
| Nebraska | 91.3 | 99.5 | 78.1 | 92.1 | 87.4 | 105.6 | 97.9 |
| Nevada | 100.7 | 103.8 | 110.5 | 81.3 | 115.6 | 105.4 | 91.1 |
| New Hampshire | 110.1 | 100.0 | 116.5 | 116.4 | 106.0 | 106.5 | 108.8 |
| New Jersey | 118.8 | 109.1 | 144.3 | 110.3 | 103.8 | 115.8 | 107.0 |
| New Mexico | 89.9 | 96.0 | 83.2 | 80.0 | 89.5 | 101.9 | 94.0 |
| New York | 124.7 | 100.3 | 172.3 | 102.2 | 111.5 | 108.9 | 104.9 |
| North Carolina | 96.6 | 100.8 | 91.7 | 94.3 | 92.3 | 108.4 | 99.2 |
| North Dakota | 90.7 | 94.1 | 77.2 | 86.4 | 96.7 | 107.7 | 98.3 |
| Ohio | 93.7 | 98.9 | 86.3 | 100.9 | 92.7 | 96.5 | 96.0 |
| Oklahoma | 83.5 | 93.5 | 66.9 | 94.5 | 83.7 | 98.1 | 88.8 |
| Oregon | 109.6 | 104.5 | 117.4 | 96.3 | 115.4 | 115.3 | 106.1 |
| Pennsylvania | 96.2 | 99.0 | 84.1 | 108.4 | 104.2 | 95.1 | 100.5 |
| Rhode Island | 111.2 | 103.8 | 114.4 | 122.3 | 103.1 | 104.1 | 111.9 |
| South Carolina | 91.9 | 98.6 | 79.8 | 95.1 | 94.6 | 97.6 | 97.3 |
| South Dakota | 94.1 | 97.6 | 88.2 | 85.4 | 100.1 | 104.1 | 96.9 |
| Tennessee | 88.9 | 95.8 | 80.3 | 84.5 | 87.2 | 88.7 | 95.0 |
| Texas | 90.7 | 95.9 | 77.7 | 104.0 | 90.9 | 96.8 | 95.6 |
| Utah | 100.6 | 98.6 | 110.8 | 84.4 | 96.2 | 89.9 | 99.2 |
| Vermont | 113.0 | 99.6 | 127.5 | 112.0 | 109.0 | 108.2 | 108.2 |
| Virginia | 99.1 | 99.3 | 99.1 | 99.5 | 98.0 | 96.9 | 99.6 |
| Washington | 114.6 | 106.1 | 123.1 | 99.4 | 131.2 | 110.3 | 111.0 |
| West Virginia | 87.9 | 96.2 | 71.3 | 90.4 | 99.5 | 89.5 | 94.9 |
| Wisconsin | 97.4 | 100.9 | 96.6 | 96.0 | 89.8 | 105.3 | 97.7 |
| Wyoming | 93.7 | 98.9 | 86.5 | 92.4 | 87.7 | 97.0 | 99.3 |
Some categories buck the overall trend. Texas is 9.3% cheaper than average despite above-average utility costs, while Minnesota has below-average housing costs but health costs 11.5% above average.
Learn More on the Voronoi App
For a different perspective on U.S. state economies, check out this graphic, which maps each state’s country equivalent in GDP terms on Voronoi.