Where Is the Reading Gender Gap the Widest?
Key Takeaways:
- Girls recorded higher mean reading scores than boys in 89 of the 90 education systems tested in PISA 2025.
- Rwanda was the only education system where boys recorded a higher mean reading score than girls, leading by six points.
- The OECD-wide reading gap widened by five points from 2022 to 2025, largely because boys’ scores fell more sharply.
The Programme for International Student Assessment (PISA) measures how well 15-year-olds can apply reading, mathematics, and science skills to real-world challenges. Its latest results show a wide gender gap in reading performance.
How Big Is the Reading Gap Between Girls and Boys?
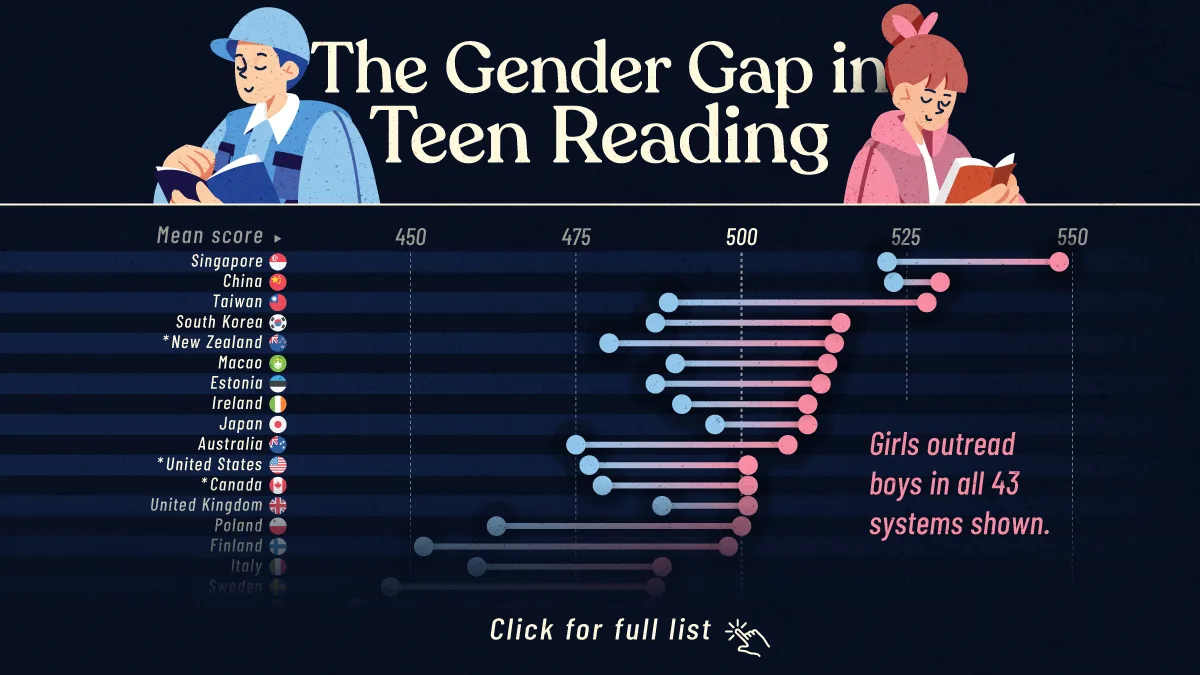
The table below shows mean reading scores by gender from the OECD’s PISA 2025 Results.
| Country/Economy | Girls (Avg. score) |
Boys (Avg. score) |
Difference (Girls – Boys) |
|---|---|---|---|
 Singapore Singapore |
548 | 522 | 26 |
 B-S-J-Z (China) B-S-J-Z (China) |
530 | 523 | 7 |
 Chinese Taipei Chinese Taipei |
528 | 489 | 39 |
 Korea Korea |
515 | 487 | 28 |
 New Zealand* New Zealand* |
514 | 480 | 33 |
 Macao (China) Macao (China) |
513 | 490 | 22 |
 Estonia Estonia |
512 | 487 | 25 |
 Japan Japan |
510 | 496 | 14 |
 Ireland Ireland |
510 | 491 | 19 |
 Australia Australia |
507 | 475 | 31 |
 United Kingdom United Kingdom |
501 | 488 | 14 |
 Canada* Canada* |
501 | 479 | 22 |
 United States* United States* |
501 | 477 | 24 |
 Poland Poland |
500 | 463 | 37 |
 Finland Finland |
498 | 452 | 46 |
 Italy Italy |
488 | 460 | 28 |
 Sweden Sweden |
487 | 447 | 41 |
 Hong Kong (China) Hong Kong (China) |
486 | 474 | 12 |
 Lithuania Lithuania |
486 | 442 | 44 |
 Switzerland Switzerland |
485 | 454 | 31 |
 Czechia Czechia |
484 | 454 | 31 |
 Belgium Belgium |
483 | 450 | 33 |
 Türkiye Türkiye |
482 | 460 | 22 |
 Austria Austria |
480 | 454 | 26 |
 Portugal Portugal |
479 | 445 | 33 |
 Germany Germany |
478 | 453 | 25 |
 Croatia Croatia |
477 | 430 | 47 |
 Denmark Denmark |
476 | 445 | 31 |
 France France |
473 | 441 | 32 |
 Norway* Norway* |
473 | 434 | 39 |
 Slovenia Slovenia |
471 | 420 | 52 |
 Slovak Republic Slovak Republic |
466 | 429 | 37 |
 Spain Spain |
464 | 439 | 26 |
 Hungary Hungary |
462 | 442 | 20 |
 Netherlands* Netherlands* |
459 | 424 | 35 |
 Luxembourg Luxembourg |
458 | 429 | 30 |
 Israel Israel |
455 | 417 | 38 |
 United Arab Emirates United Arab Emirates |
451 | 414 | 37 |
 Latvia Latvia |
450 | 409 | 42 |
 Chile Chile |
446 | 425 | 21 |
 Greece Greece |
446 | 400 | 46 |
 Montenegro Montenegro |
440 | 399 | 41 |
 Iceland Iceland |
439 | 408 | 31 |
 Brunei Darussalam Brunei Darussalam |
438 | 414 | 25 |
 Qatar Qatar |
438 | 398 | 40 |
 Malta Malta |
438 | 392 | 47 |
 Uruguay Uruguay |
436 | 411 | 25 |
 Serbia Serbia |
435 | 395 | 40 |
 Ukrainian regions (17 of 27) Ukrainian regions (17 of 27) |
434 | 402 | 32 |
 Romania Romania |
429 | 399 | 30 |
 Costa Rica Costa Rica |
423 | 409 | 14 |
 Albania* Albania* |
423 | 391 | 32 |
 Moldova Moldova |
423 | 385 | 38 |
 Brazil Brazil |
419 | 397 | 21 |
 Mauritius Mauritius |
415 | 395 | 20 |
 Mexico Mexico |
414 | 402 | 12 |
 Bulgaria Bulgaria |
412 | 364 | 49 |
 Colombia Colombia |
407 | 391 | 16 |
 Thailand Thailand |
406 | 376 | 30 |
 Georgia Georgia |
406 | 364 | 42 |
 Viet Nam Viet Nam |
404 | 379 | 25 |
 Malaysia Malaysia |
403 | 382 | 22 |
 Cyprus Cyprus |
401 | 357 | 44 |
 Saudi Arabia Saudi Arabia |
400 | 374 | 26 |
 Peru Peru |
399 | 382 | 17 |
 Kazakhstan Kazakhstan |
398 | 372 | 27 |
 Argentina Argentina |
394 | 385 | 9 |
 Ecuador Ecuador |
394 | 376 | 18 |
 Azerbaijan Azerbaijan |
392 | 356 | 36 |
 Mongolia Mongolia |
390 | 358 | 31 |
 Philippines Philippines |
380 | 354 | 27 |
 Jordan Jordan |
379 | 346 | 33 |
 Indonesia Indonesia |
377 | 353 | 24 |
 El Salvador El Salvador |
375 | 358 | 17 |
 Palestinian Authority Palestinian Authority |
374 | 319 | 56 |
 North Macedonia North Macedonia |
373 | 342 | 31 |
 Dushanbe (Tajikistan) Dushanbe (Tajikistan) |
372 | 364 | 8 |
 Armenia Armenia |
368 | 327 | 40 |
 Paraguay Paraguay |
361 | 343 | 18 |
 Dominican Republic Dominican Republic |
360 | 330 | 30 |
 Kyrgyzstan Kyrgyzstan |
358 | 331 | 27 |
 Kosovo Kosovo |
358 | 322 | 35 |
 Cambodia Cambodia |
355 | 338 | 17 |
 Guatemala Guatemala |
342 | 333 | 9 |
 Lebanon Lebanon |
335 | 326 | 10 |
 Morocco Morocco |
329 | 313 | 17 |
 Kurdistan Region (Iraq) Kurdistan Region (Iraq) |
328 | 295 | 33 |
 Zambia Zambia |
326 | 324 | 2 |
 Kenya Kenya |
322 | 319 | 3 |
 Rwanda Rwanda |
298 | 304 | -6 |
 OECD average OECD average |
476 | 446 | 30 |
*Indicates low school and student participation, with rates falling below international standards.
Rwanda was the lone system where boys posted a higher mean score, leading by six points. Girls had higher mean scores in the other 89 systems, although the differences in Kenya and Zambia were not statistically significant. The largest gaps favoring girls reached 45 points or more in seven systems.
Among OECD countries, 37% of boys failed to reach baseline reading proficiency, compared with 25% of girls. At the top end, 7% of girls and 5% of boys reached Level 5 or higher.
These differences emerge well before age 15: multicountry research has found a female reading advantage in early primary grades, while U.S. research has observed gaps from fourth grade onward.
Why Does the Reading Gap Persist?
Engagement may be part of the picture. UNESCO reports that boys tend to express less enjoyment of and confidence in reading, while UK research similarly finds lower reading enjoyment among boys. These patterns suggest the gap cannot be reduced to ability alone.
Recent declines have also been steeper among boys. From 2022 to 2025, boys’ OECD-average reading scores fell 17 points, compared with a 12-point decline for girls, widening the gender gap by five points.
The divide also provides context for later educational patterns, with stark differences emerging in women’s and men’s participation in higher education. Reading proficiency can influence access to further education and, in turn, earning prospects in the workforce.
Learn More on the Voronoi App
Explore The Largest Gender Pay Gaps in OECD Countries to see how gender differences appear later in the labor market.