Who Leads the Global Fertilizer Trade?
Key Takeaways
- Russia is the world’s largest fertilizer exporter, shipping 23.2 million tonnes by nutrient content in 2024.
- Canada, China, Morocco, and Russia together account for 53% of global fertilizer exports.
- Mineral deposits and energy supplies help shape which countries lead the fertilizer trade.
The global food supply depends on a fertilizer trade concentrated among a relatively small group of countries.
Farmers use fertilizers to replenish nutrients and support crop growth. Producing them at scale depends heavily on access to key mineral deposits and energy resources.
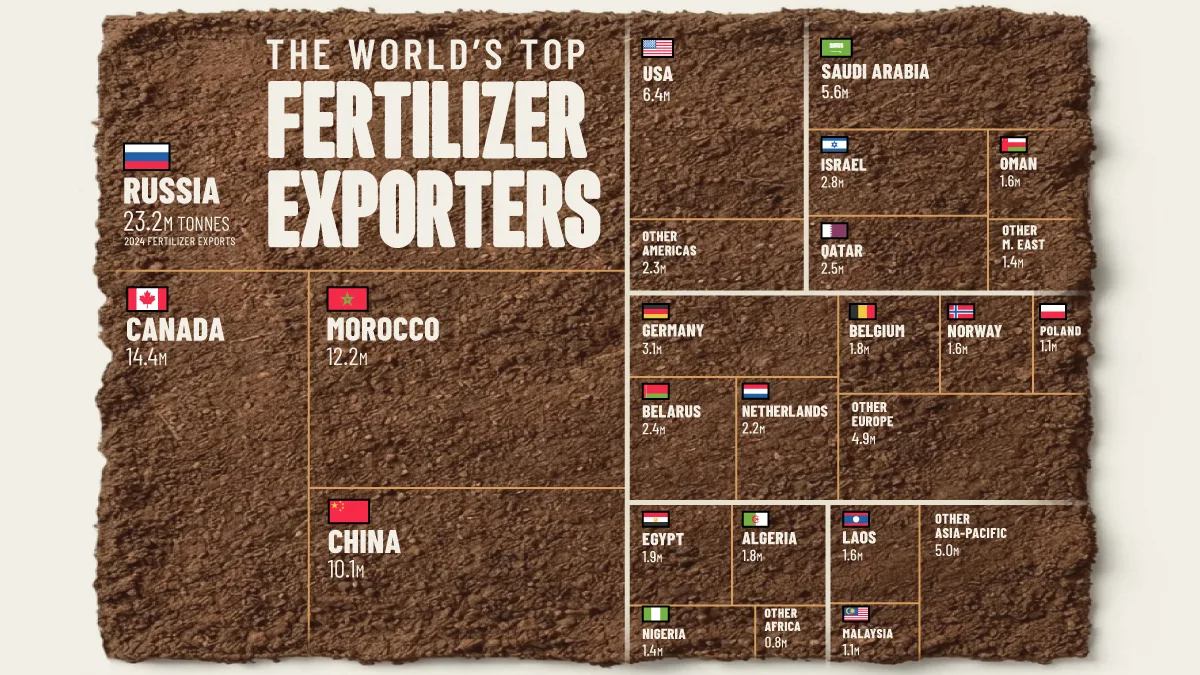
This visualization ranks the world’s largest fertilizer exporters using the latest figures available (2024) from the Food and Agriculture Organization. It combines nitrogen, phosphate, and potash exports, measured by nutrient content rather than the full weight of fertilizer products.
The Big Four Fertilizer Exporters
Global fertilizer exports topped 113.3 million tonnes in 2024, with the four largest exporters accounting for more than half of the total.
Russia leads the ranking with 23.2 million tonnes, followed by Canada (14.4 million), Morocco (12.2 million), and China (10.1 million).
The table below ranks the world’s top fertilizer exporters in 2024 based on total tonnes exported.
| Rank | Country | 2024 fertilizer exports (tonnes) |
|---|---|---|
| 1 |  Russia Russia |
23,234,623 |
| 2 |  Canada Canada |
14,419,294 |
| 3 |  Morocco Morocco |
12,154,362 |
| 4 |  China China |
10,126,069 |
| 5 |  U.S. U.S. |
6,372,572 |
| 6 |  Saudi Arabia Saudi Arabia |
5,589,139 |
| 7 |  Germany Germany |
3,136,446 |
| 8 |  Israel Israel |
2,782,901 |
| 9 |  Qatar Qatar |
2,471,034 |
| 10 |  Belarus Belarus |
2,436,719 |
| 11 |  Netherlands Netherlands |
2,244,415 |
| 12 |  Egypt Egypt |
1,910,594 |
| 13 |  Belgium Belgium |
1,830,168 |
| 14 |  Algeria Algeria |
1,753,242 |
| 15 |  Oman Oman |
1,649,407 |
| 16 |  Norway Norway |
1,641,508 |
| 17 |  Laos Laos |
1,629,908 |
| 18 |  Nigeria Nigeria |
1,415,355 |
| 19 |  Poland Poland |
1,070,679 |
| 20 |  Malaysia Malaysia |
1,061,170 |
| 21 |  Turkmenistan Turkmenistan |
1,024,841 |
| 22 |  Spain Spain |
865,510 |
| 23 |  Indonesia Indonesia |
748,316 |
| 24 |  Lithuania Lithuania |
727,186 |
| 25 |  Trinidad and Tobago Trinidad and Tobago |
689,636 |
| 26 |  Vietnam Vietnam |
610,681 |
| 27 |  Chile Chile |
601,601 |
| 28 |  Türkiye Türkiye |
513,686 |
| 29 |  Brunei Brunei |
497,215 |
| 30 |  Jordan Jordan |
433,747 |
| 31 |  Bulgaria Bulgaria |
381,202 |
| 32 |  South Korea South Korea |
374,965 |
| 33 |  Slovakia Slovakia |
360,260 |
| 34 |  Uzbekistan Uzbekistan |
359,536 |
| 35 |  Bahrain Bahrain |
318,528 |
| 36 |  France France |
301,235 |
| 37 |  Italy Italy |
297,626 |
| 38 |  Venezuela Venezuela |
276,721 |
| 39 |  Australia Australia |
271,208 |
| 40 |  UK UK |
265,615 |
| 41 |  Bolivia Bolivia |
263,910 |
| 42 |  Kazakhstan Kazakhstan |
260,759 |
| 43 |  Azerbaijan Azerbaijan |
259,871 |
| 44 |  South Africa South Africa |
254,092 |
| 45 |  Greece Greece |
245,335 |
| 46 |  Tunisia Tunisia |
223,833 |
| 47 |  Brazil Brazil |
205,427 |
| 48 |  Sweden Sweden |
201,946 |
| 49 |  Thailand Thailand |
198,058 |
| 50 |  Serbia Serbia |
184,174 |
| 51 |  Portugal Portugal |
175,072 |
| 52 |  Hungary Hungary |
174,732 |
| 53 |  India India |
155,111 |
| 54 |  Czechia Czechia |
145,631 |
| 55 |  Georgia Georgia |
131,526 |
| 56 |  Taiwan Taiwan |
124,326 |
| 57 |  Mexico Mexico |
121,036 |
| 58 |  Japan Japan |
105,137 |
| 59 |  Romania Romania |
95,519 |
| 60 |  Côte d’Ivoire Côte d’Ivoire |
94,742 |
| 61 |  Croatia Croatia |
86,147 |
| 62 |  Latvia Latvia |
64,310 |
| 63 |  Slovenia Slovenia |
59,726 |
| 64 |  Lebanon Lebanon |
59,118 |
| 65 |  Finland Finland |
51,017 |
| 66 |  Colombia Colombia |
40,997 |
| 67 |  Namibia Namibia |
40,182 |
| 68 |  Honduras Honduras |
36,650 |
| 69 |  Mozambique Mozambique |
34,813 |
| 70 |  Tanzania Tanzania |
29,417 |
| 71 |  Denmark Denmark |
29,249 |
| 72 |  Senegal Senegal |
28,976 |
| 73 |  Kenya Kenya |
28,094 |
| 74 |  Dominican Republic Dominican Republic |
22,095 |
| 75 |  Peru Peru |
21,757 |
| 76 |  United Arab Emirates United Arab Emirates |
20,627 |
| 77 |  Guatemala Guatemala |
19,637 |
| 78 |  Ghana Ghana |
19,325 |
| 79 |  Philippines Philippines |
19,041 |
| 80 |  Iran Iran |
16,938 |
| 81 |  Austria Austria |
15,574 |
| 82 |  Singapore Singapore |
15,198 |
| 83 |  Ireland Ireland |
14,811 |
| 84 |  Madagascar Madagascar |
14,692 |
| 85 |  Costa Rica Costa Rica |
13,587 |
| 86 |  Ukraine Ukraine |
13,291 |
| 87 |  Mali Mali |
13,089 |
| 88 |  Luxembourg Luxembourg |
12,538 |
| 89 |  El Salvador El Salvador |
12,420 |
| 90 |  Eswatini Eswatini |
9,464 |
| 91 |  Uruguay Uruguay |
7,628 |
| 92 |  Estonia Estonia |
6,768 |
| 93 |  Panama Panama |
4,340 |
| 94 |  Guyana Guyana |
3,527 |
| 95 |  North Macedonia North Macedonia |
2,869 |
| 96 |  Ecuador Ecuador |
1,585 |
| 97 |  Bosnia and Herzegovina Bosnia and Herzegovina |
1,543 |
| 98 |  North Korea North Korea |
1,265 |
| 99 |  Hong Kong Hong Kong |
1,244 |
| 100 |  Kuwait Kuwait |
1,237 |
| 101 |  Malawi Malawi |
1,000 |
| 102 |  Paraguay Paraguay |
972 |
| 103 |  Bahamas Bahamas |
884 |
| 104 |  Syria Syria |
612 |
| 105 |  Angola Angola |
583 |
| 106 |  Iraq Iraq |
579 |
| 107 |  Pakistan Pakistan |
570 |
| 108 |  New Zealand New Zealand |
543 |
| 109 |  Burkina Faso Burkina Faso |
539 |
| 110 |  Cameroon Cameroon |
523 |
| 111 |  Tajikistan Tajikistan |
450 |
| 112 |  Libya Libya |
349 |
| 113 |  Uganda Uganda |
334 |
| 114 |  Switzerland Switzerland |
327 |
| 115 |  Togo Togo |
315 |
| 116 |  Botswana Botswana |
233 |
| 117 |  Moldova Moldova |
232 |
| 118 |  Kyrgyzstan Kyrgyzstan |
176 |
| 119 |  Mauritius Mauritius |
155 |
| 120 |  Bangladesh Bangladesh |
131 |
| 121 |  Armenia Armenia |
116 |
| 122 |  Gambia Gambia |
101 |
| 123 |  Benin Benin |
54 |
| 124 |  Jamaica Jamaica |
42 |
| 125 |  Albania Albania |
36 |
| 126 |  Liberia Liberia |
20 |
| 127 |  Congo Congo |
18 |
| 128 |  Cyprus Cyprus |
9 |
| 129 |  DR Congo DR Congo |
8 |
| 130 |  Palestine Palestine |
8 |
| 131 |  Cuba Cuba |
6 |
| 132 |  Niger Niger |
6 |
| 133 |  Cambodia Cambodia |
3 |
| 134 |  Montenegro Montenegro |
3 |
| 135 |  Sri Lanka Sri Lanka |
2 |
| 136 |  Suriname Suriname |
1 |
| Total | 113,373,883 |
These totals combine different parts of the fertilizer industry, each supplying essential nutrients for agriculture. Potash supplies potassium, while phosphate fertilizers supply phosphorus. Nitrogen fertilizers follow a different production process.
As a result, strength in one fertilizer category does not necessarily translate to strength in another. The four leading exporters dominate different parts of the market.
Mining Potash and Phosphate
Canada’s position starts underground. Its potash industry draws on extensive deposits in Saskatchewan, giving the country an advantage that producers without comparable resources cannot easily replicate.
Canada supplies over 70% of the potash consumed in the United States. Efforts to replace Canadian supply with smaller producers, such as Belarus (2.4 million tonnes), therefore face significant logistical challenges.
Morocco, meanwhile, is a major producer of phosphate rock. State-owned OCP Group mines the resource and processes it into phosphoric acid and phosphate fertilizers. OCP alone holds over 30% of the global phosphate market, generating revenue of nearly $10 billion in 2024.
Energy-Intensive Nitrogen Production
For nitrogen fertilizer, the constraint is different. Nitrogen is abundant in the air, but converting it into ammonia, the starting point for mineral nitrogen fertilizers, requires substantial energy and a source of hydrogen.
Natural gas commonly provides both the fuel and the raw material needed to produce that hydrogen. Access to relatively low-cost gas has helped Russia, along with exporters such as Qatar (2.5 million tonnes) and the U.S. (6.4 million tonnes), expand ammonia production.
China, meanwhile, developed much of its ammonia industry around abundant coal supplies instead. The country produces more coal than the rest of the world combined.
Learn More on the Voronoi App
To see how one major market has maintained demand for fertilizer, check out EU Has Continued to Buy Russian Fertilizer Throughout War on Voronoi.