How U.S. Wealth Breaks Down by Generation
Key Takeaways
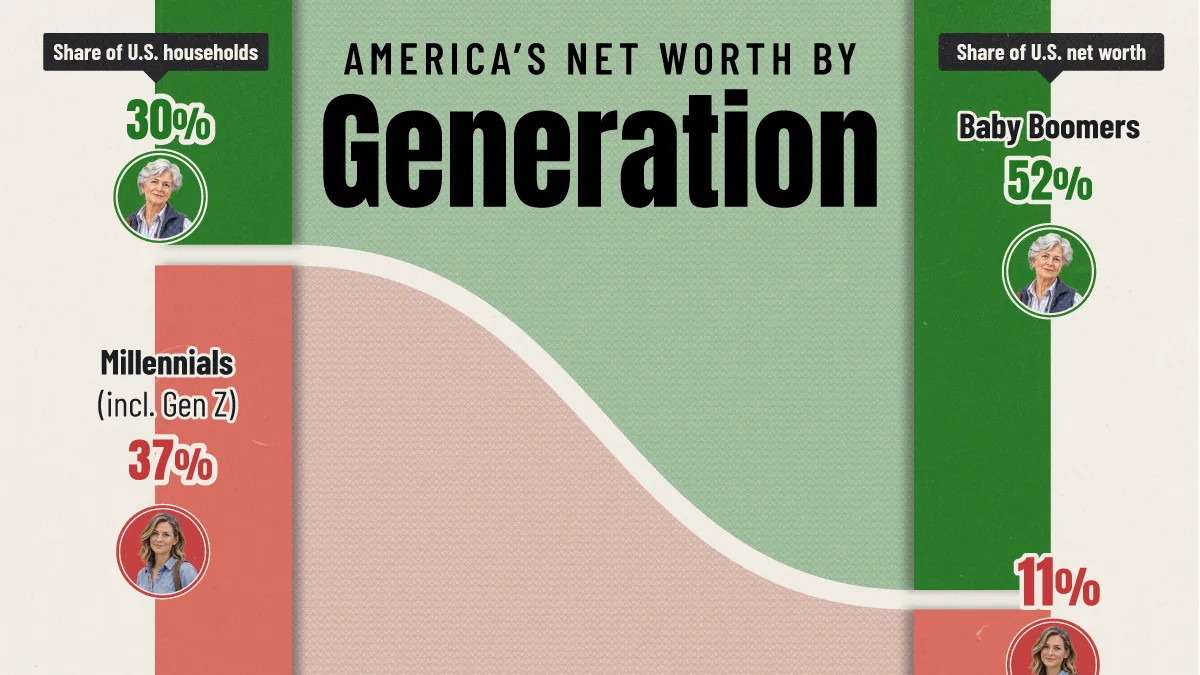
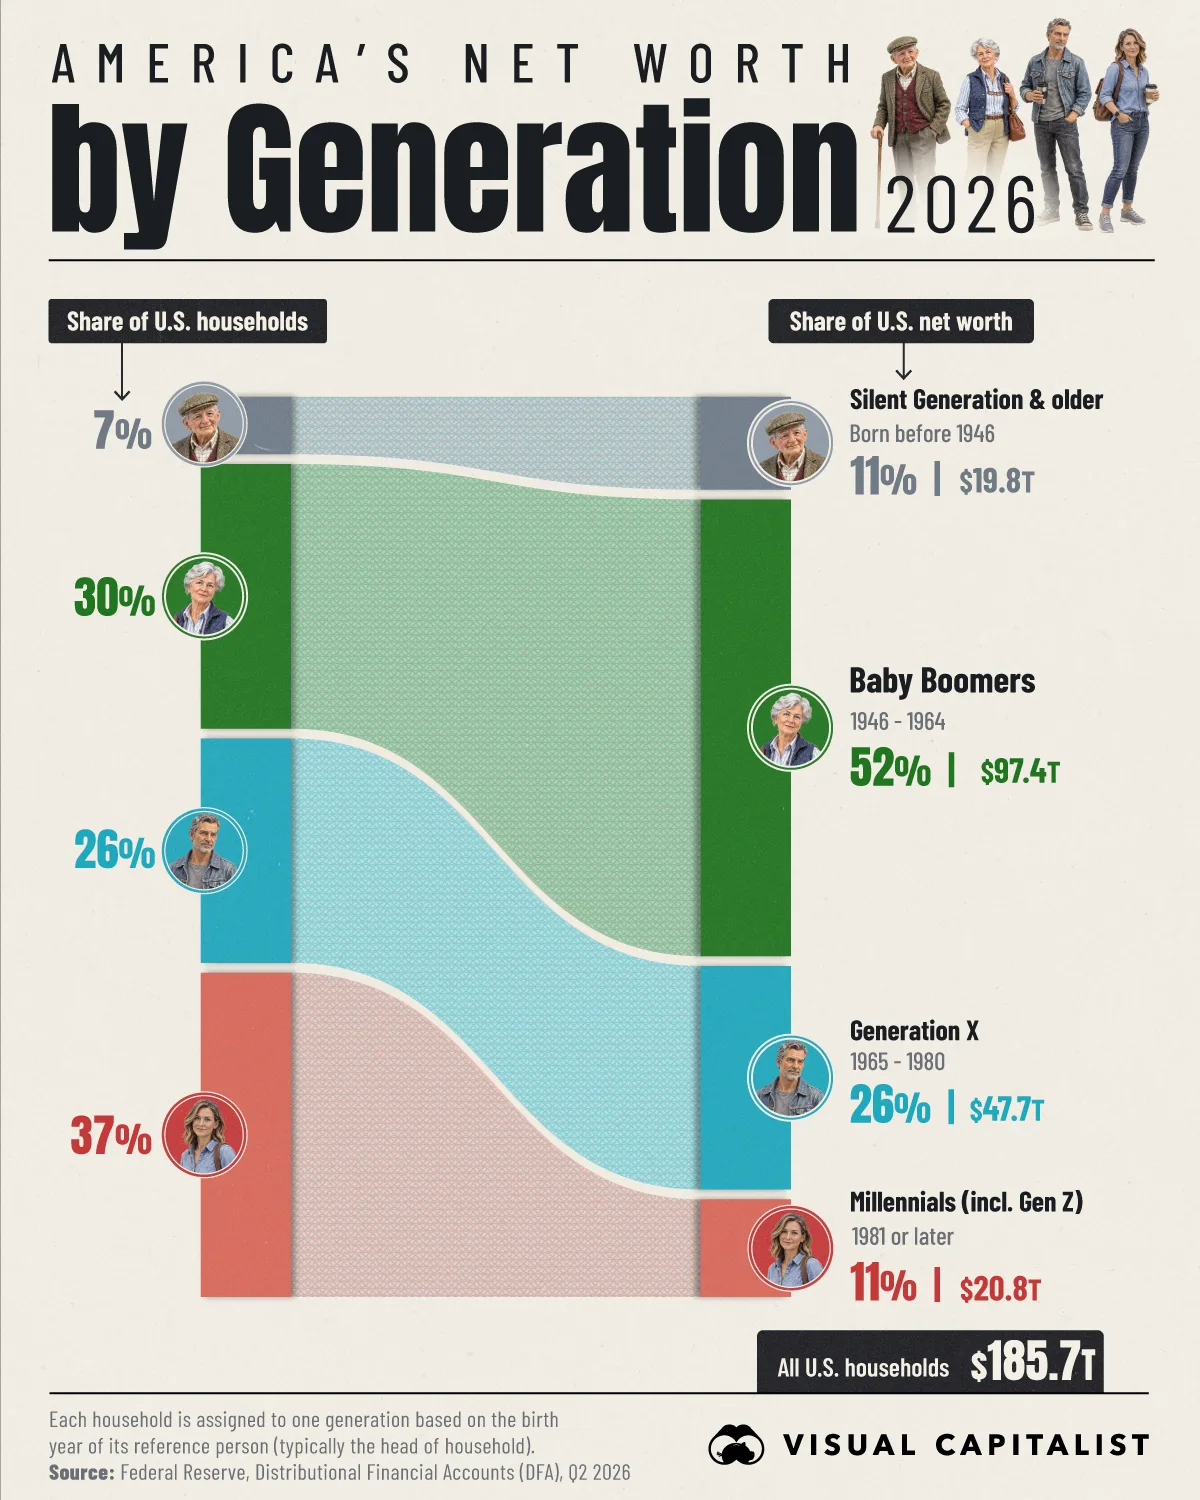
- Baby Boomers hold $97.4 trillion, or 52% of U.S. household net worth, despite making up just 30% of households.
- Millennials and Gen Z account for 37% of U.S. households, more than any other generation, but hold only 11% of household wealth.
American households are worth a combined $185.7 trillion, and more than half of that belongs to a single generation.
This graphic compares each generation’s share of U.S. households with its share of household net worth as of Q2 2026, using data from the Federal Reserve’s Distributional Financial Accounts.
Net worth is assets such as homes, stocks, and pensions minus debts like mortgages and credit cards. The Fed assigns each household to a generation based on the birth year of its reference person, typically the head of household, and counts everyone born in 1981 or later as a Millennial, so Gen Z is included in that group.
Why Baby Boomers Hold So Much U.S. Wealth
Decades of accumulating stocks, homes, and pension savings have left Baby Boomers, born between 1946 and 1964, with the largest share of U.S. household wealth.
Generation X is the only generation whose share of wealth closely matches its share of households, at 26% for each, with $47.7 trillion in net worth.
The table below shows each generation’s share of U.S. households and household net worth as of Q2 2026:
| Generation | Birth Years | U.S. Household Wealth by Generation, Q2 2026 | ||
|---|---|---|---|---|
| Share of Households (%) | Share of Net Worth (%) | Net Worth ($T) | ||
| Silent Generation and older |
Before 1946 | 6.6 | 10.7 | 19.78 |
| Baby Boomers | 1946–1964 | 30.4 | 52.5 | 97.40 |
| Generation X | 1965–1980 | 25.8 | 25.7 | 47.66 |
| Millennials (incl. Gen Z) |
1981 or later | 37.2 | 11.2 | 20.80 |
| All U.S. households | — | 100.0 | 100.0 | 185.65 |
The Silent Generation and older now head just 7% of households, but those households hold 11% of U.S. household wealth, averaging about $2.2 million in net worth each.
Stock ownership helps set Boomers’ wealth apart. They hold $35.2 trillion in stocks and mutual funds, or 55% of the household total. Their net worth rose by $7.9 trillion in Q2 2026 alone, with $5.5 trillion of that increase coming from equities. That quarterly equity gain alone was equal to more than a quarter of all Millennial and Gen Z wealth.
Millennial Wealth Is Growing, but Boomers Are Adding More
Millennials and Gen Z have grown from 4.9% of U.S. household net worth in Q2 2020 to 11.2% today, as their wealth nearly quadrupled from $5.3 trillion to $20.8 trillion.
Even so, Boomer net worth rose by $38.2 trillion over the same six years, compared with $15.5 trillion for Millennials and Gen Z, who make up the largest generational group in America. A smaller percentage gain on a much larger base can still add more dollars.
The table below shows each generation’s share of U.S. household net worth in the second quarter of every sixth year since 1990:
| Generation | Share of U.S. Household Net Worth by Year (%) | ||||||
|---|---|---|---|---|---|---|---|
| 1990 | 1996 | 2002 | 2008 | 2014 | 2020 | 2026 | |
| Silent Generation and older | 79.7 | 67.7 | 52.3 | 39.5 | 27.3 | 15.9 | 10.7 |
| Baby Boomers | 19.8 | 30.1 | 42.2 | 51.6 | 55.5 | 54.3 | 52.5 |
| Generation X | 0.5 | 2.2 | 5.5 | 8.6 | 15.7 | 24.9 | 25.7 |
| Millennials (incl. Gen Z) | 0.0 | 0.0 | 0.1 | 0.3 | 1.6 | 4.9 | 11.2 |
| Total | 100.0 | 100.0 | 100.0 | 100.0 | 100.0 | 100.0 | 100.0 |
The Silent Generation held 80% of household wealth in 1990 and holds 11% today. The Boomer share peaked at 55.5% in 2014 and has slipped only three percentage points since, even as Boomers’ share of households fell from 36% to 30%.
Millennial balance sheets also look very different. Real estate makes up 38% of their assets, compared with 20% for Boomers, and they owe $8.6 trillion, or 43% of all household debt. That is more than Boomers and the Silent Generation owe combined, and equal to 29% of Millennial assets versus 4% for Boomers.
The generational wealth picture will continue to change as Boomers age and assets are transferred to younger generations. How quickly that reshapes the chart will depend not only on inheritances, but also on asset prices, debt, homeownership, and how wealth is distributed within each generation.
Learn More on the Voronoi App
If you enjoyed today’s post, check out Wealth by Generation in the United States on Voronoi.