

Overlapping with the inaugural Solar Manufacturing USA 2026 in Austin, Texas last week on 22-23 September 2026, Terawatt PV Research released a new quarterly market research report, focused exclusively on domestic U.S. solar manufacturing; the Solar Manufacturing USA Quarterly report.
The findings reveal that 22 companies are included in the Q3 2026 ratings pyramid that ranks U.S. solar PV manufacturers using a new methodology based on production volumes and manufacturing capital expenditure (capex).
First Solar is the only AAA-rated company in the ratings pyramid, with a total of six companies rated A and above. The AAA, AA, and A rating categories are generally comprised of companies actively producing (or in final stages of capex spending) at more than one stage of the value-chain.
Companies with B and C ratings are typically active at one part of the silicon-based value-chain, such as ES Foundry and Suniva for cells and SEG Solar, Illuminate and Waaree Energies for modules.
Collectively, the 22 companies included in the Q3 2026 ratings pyramid are responsible for more than 95% of U.S. production output and manufacturing capex, providing excellent validation of the underlying data-collection and benchmarking analysis.
U.S. solar manufacturing needs quality research, not guesswork
Over the past 30 years, the solar PV industry has routinely been presented with numbers and graphics in which capacity announcements from different companies are simply added up to give often sensationalized and inflated totals.
Diligent market research in the solar industry has no place for adding up capacity numbers in this manner, with the output here being confusing and misleading. This is especially true when capacity figures used in press releases or ad-hoc announcements are included.
The only capacity numbers that can be added are ‘effective ramped capacity’ figures. However, even here, the totals need to be qualified. An effective ramped capacity number for one of First Solar’s factories (running typically at >95% yield levels) is very different to a ramped capacity number for a new GW-scale entrant in the U.S. that is initially focused on hiring workers to operate the production lines (and by default having yield levels below 10-20%).
Market research is about tracking production, not capacity. Effective ramped capacity helps frame the potential of an individual factory, but it is fundamentally the output (production) of the sites that needs to be tracked and forecasted.
Since many companies active in the solar industry are one-segment and one-product weighted from a sales perspective, production is by default the metric of value to understand company revenues at the operating level, while also feeding into material supply volumes through a cost-of-goods-sold (or COGS) analysis.
A similar level of diligence is required for investments made into domestic U.S. solar PV manufacturing sites.
Little value is obtained simply be adding marketing-driven ‘investment’ claims or goals. Except for U.S.-based public-listed companies, privately held companies tend to use investment figures as aspirational targets, often boosted by inferred levels of local-economy monetary benefits. Such investment announcements also tend to be heavily forward looking, based on factory expansions that often have limited prospects of coming to fruition, and frequently issued merely to convey credibility to customers.
Manufacturing capital expenditure (capex) is the go-to metric when reviewing and benchmarking actual spending levels, including funds committed by a company to acquire, upgrade and maintain physical assets such as buildings, factory equipment and technology.
Capex is the natural companion to production since capex is the ultimate measure of long-term productivity within what is a capital-intensive, operating-leverage-heavy solar PV manufacturing business.
The collective and interconnected impact of production and capex
Within a single-product manufacturing business, such as solar PV cells or modules, production and capex have a direct impact on a company’s income statement, balance sheet and cash flow statement.
For the income statement, production volume drive top-line revenue, with average selling prices (ASPs) highly market-dependent. Capex impacts the cost of goods sold (COGS) via depreciation – meaning production yield and factory ramp costs directly impact operating margins.
The balance sheet tracks the long-term financial risk taken to fund this spending on capacity, where substantial non-current assets are balanced by either a surge in long-term debt or equity dilution.
Finally, capex represents a significant and immediate outgoing on the cash flow statement, creating a liquidity deficit during the period between initial factory build-out and revenue recognition.
Understanding the correlation between production and capex is key because it reveals a solar company’s structural operating leverage – how vulnerable the company is to price swings when locked into high fixed manufacturing overheads.
Typically, the specific financing mechanisms used to bridge this gap – funding capex through internal cash generation, debt, or equity – dictate the long-term survival and competitive prospects of any solar manufacturer.
Furthermore, because the solar industry is prone to technological obsolescence (such as shifting from older cell architectures to newer technologies), companies must constantly reinvest or continue to commit capex to retain or grow market share.
If a solar manufacturing company funds its capex primarily with debt, a sudden drop in market ASPs can compress margins to the point where the company can no longer service interest obligations. Conversely, while relying on cash reserves or equity dilution can protect the balance sheet from bankruptcy, it can restrict expansion or dilute shareholder value.
Over the past few decades, the ability to manage this profit-and-debt loop has defined the market leaders in solar PV manufacturing; between those that can sustainably scale operations and others that succumb to liquidity crises during inevitable industry downturn cycles.
There are way more causalities than survivors in the history of solar PV manufacturing, and there is no reason to suggest that this trend will not be continued in the United States given the rapid increase of new entrants over the past few years and a company-count that has reached about 50 already.
Therefore, having granular visibility on the production capacities and capex health of these 50 or so companies in the U.S. PV manufacturing space today is essential for the domestic stakeholder community.
For project developers, financiers, and upstream suppliers whose long-term strategy depends on doing business with these manufacturers, assessing these metrics is a prerequisite for risk mitigation. Evaluating a manufacturer’s capex stability and production ramp-up timeline ensures that domestic stakeholders can confidently enter into long-term module purchasing agreements or material supply arrangements without exposing themselves to counterparty insolvency risks or supply chain disruptions.
The new Terawatt PV Research methodology
A recent article described the detailed methodology developed by the author to combine manufacturing site specific production and capex data that can be consolidated across multiple categories.
By segmenting both production and capex at the site level across location categories, technology types, and capex sub-categories (buildings/infrastructure, equipment, and maintenance and upgrades), the entire U.S. solar PV manufacturing landscape can be explained and forecast to a level not seen before.
A simplified version of the methodology process flow is shown below when applied at the company level to output manufacturing scores, or rankings.
The rankings are converted into standardized company ratings (AAA, AA, A, B and C) by mapping Z-Score thresholds to distinct distribution bands.
Unlike predictive models such as regression analysis – which often rely on qualitative, observable inputs or subjectively defined dependent variables – this new Z-Score framework ensures absolute empirical objectivity. By grounding the rating tiers strictly within the properties of a standard normal distribution, category assignment becomes a function of mathematical variance rather than qualitative conjecture.
Many, if not all, previous methods used to rank or rate solar manufacturers have relied largely on some form of qualitative conjecture and have typically been limited purely to module suppliers and not manufacturers across the whole value-chain (such as polysilicon, wafer and cell producers).
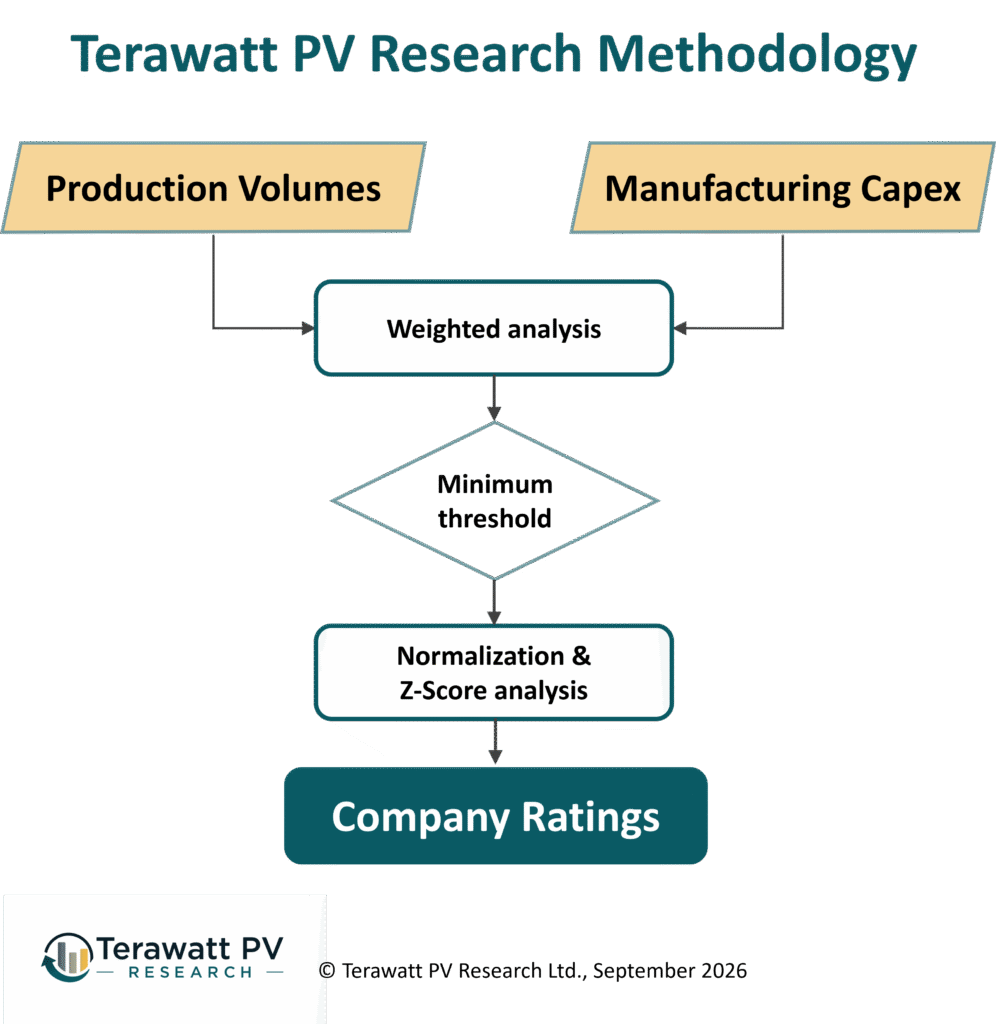
Figure 1: Basic process flow of the new methodology developed by Terawatt PV Research in which the production and capex values for manufacturing sites of U.S. PV companies are used as the input to create company-specific rankings and ratings.
Validation of the company ratings methodology
Because solar PV manufacturing (in the United States and globally) is highly consolidated and dominated by a small group of market leaders, the resulting ratings naturally follow a top-heavy distribution.
A pyramid graphic is the optimal visual means here. The apex restricts the coveted AAA status to the elite statistical outliers, while the widening base visually accounts for the vast cohort of smaller market participants or new entrants.
Presenting a year-by-year pyramid sequence for U.S. solar PV manufacturers from 2020 to 2026 provides the ultimate visual narrative for how the solar manufacturing landscape has been transformed over this time.
By focusing on the leading companies that define the apex of each period, these pyramids illustrate sector evolution at a single glance. Viewers can instantly track the rise, dominance, or displacement of specific industry leaders over this period, revealing exactly which companies have steered the sector’s trajectory and the companies that have entered the market since the Inflation Reduction Act was introduced at the end of 2022.
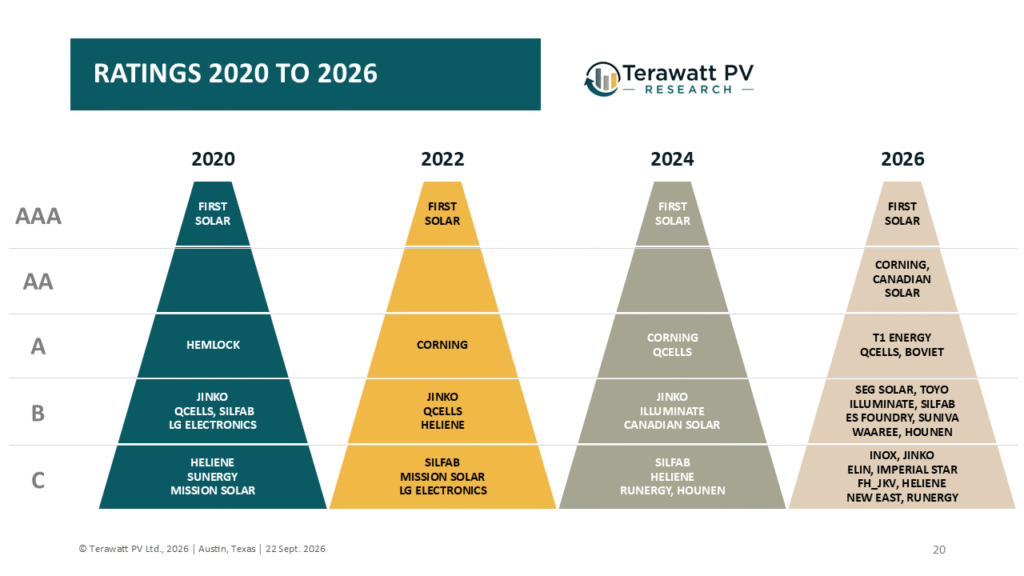
Figure 2: Presented at the inaugural Solar Manufacturing USA 2026 event in Austin, Texas on 22 September 2026, the year-end ratings pyramids for 2020, 2022, 2024 and 2026 show exactly how the domestic U.S. PV manufacturing landscape has been shaped by the introduction of the Inflation Reduction Act in 2022.
The pyramids for 2020 and 2022 reveal the landscape before the introduction of the Inflation Reduction Act, with First Solar the dominant participant by some margin. Hemlock in 2020, subsequently relabelled here as Corning by 2022, was the only other major solar PV manufacturer (all polysilicon at this time for Corning). New entrants to U.S. PV manufacturing following the release of Section 201 show up by the inclusion of the c-Si module-only activities of Jinko Solar, Qcells (then branded as Hanwha Q CELLS), Silfab and Heliene.
The first sign of changes after the introduction of the Inflation Reduction Act can be seen in the pyramid for 2024, with Qcells’ investments in the Cartersville facility pushing the company into the A rating band. The major entrants at the multi-GW of module capacity, Illuminate and Canadian Solar, show up in the B ratings band.
However, the most significant changes can be seen in 2026, with 22 companies featuring in the ratings pyramid.
The first distinction comes from the differentiation in companies across the AAA, AA, and A bands and those in the B and C ratings bands.
The AAA, AA and A companies each have active participation at more than one stage in the value-chain. Corning’s AA rating is coming from its build out of ingot/wafer and module bases in Michigan and Arizona. Canadian Solar’s AA rating has contributions from significant capex and production volumes at its module assembly base in Texas and its cell fabrication fab in Indiana.
The A ratings inclusion for T1 Energy and Qcells reflects the combination of production volumes and capex across c-Si ingot-to-module activity in Georgia for Qcells, and c-Si cell and module in Texas for T1 Energy.
Boviet Solar’s A rating in 2026 can be seen as transitional, a reflection of the phasing of the legal transfer of the company’s North Carolina cell and module operations to Inox Solar Americas (itself C ranked until fully consolidated with Boviet’s legacy built factories).
Thereafter, the B and C ratings bands are mostly comprised of companies currently active at only one part of the c-Si value-chain. For example, SEG Solar, TOYO, Illuminate, and Waaree Energies for modules: ES Foundry and Suniva for cells.
Yet during this entire time, the clear outlier in the AAA rating band has been First Solar; a feature would have been seen in any equivalent company-specific analyses extending back to the 2010-2020 decade.
Articles written by the author last week showed that First Solar was responsible for almost 40% of the U.S. industry’s historic cumulative module production from the early 1970s through to the end of Q2 2026, by which point the country’s total PV module production had reached the 100 GW landmark. In addition, First Solar also accounted for about one-quarter of the entire solar PV manufacturing capex in the United States during this period.
Report details and accessing the first release
The new Solar Manufacturing USA Quarterly report is available on a subscription basis, with the first release for Q3 2026 to be distributed at the start of October 2026, after the current quarter closes.
The report is a comprehensive bottom-up analysis of about 50 companies active in the U.S. solar PV manufacturing space today, including also those expected to contribute meaningful production volumes for the first time in the coming years.
The company-specific sections of the report provide a detailed overview of each company’s U.S. manufacturing entity operations, strategy, and relationships with group-level solar PV manufacturing activity outside the United States (for example across Asia and other regions).
Value-chain production volumes for each company are then presented for the period 2020 to 2026 and forecast out to 2030, with discussion here bringing in factors such as technology-choice, and equipment and materials suppliers.
Finally, the capex for each company is shown, segmented across buildings/infrastructure, equipment and maintenance/upgrades, again presented for the period 2020 to 2030, with the forward-looking period to 2030 taking a pragmatic and informed approach to the prospects of each company adding additional capacity levels across the value-chain.
The report also provides the consolidated picture of the entire U.S. solar PV manufacturing landscape today and forecast out to the end of 2030. This part of the report is particularly informative in showing forecasted capex from existing and new stakeholders across the value-chain, regional segmentation at the production level, and potential capex to be committed going forward.
All report enquiries and subscriptions are being managed exclusively by pv magazine USA, extending the working partnership between the parties that led to the launch of the Solar Manufacturing USA event in 2026.
To register your interest in the Solar Manufacturing USA Quarterly report, please send an email to: solarmfgusa@pv-magazine.com
The post Twenty-two U.S. solar PV manufacturers included in first domestic Ratings Pyramid appeared first on pv magazine Global.


