How Do You Determine the World’s Richest Country?
Key Takeaways
- Switzerland leads in nominal GDP per capita at $103,670, while Singapore ranks first after adjusting for purchasing power at $150,689.
- Norway ranks first when GDP per capita is adjusted for both prices and hours worked, at $114,804.
- The U.S. ranks fourth in nominal GDP per capita, seventh after adjusting for prices, and sixth after accounting for working hours.
Which country is the richest in the world? The answer depends on how economic output is measured, including differences in local prices and hours worked.
These adjustments can significantly change the rankings, even when comparing the same year’s economic output.
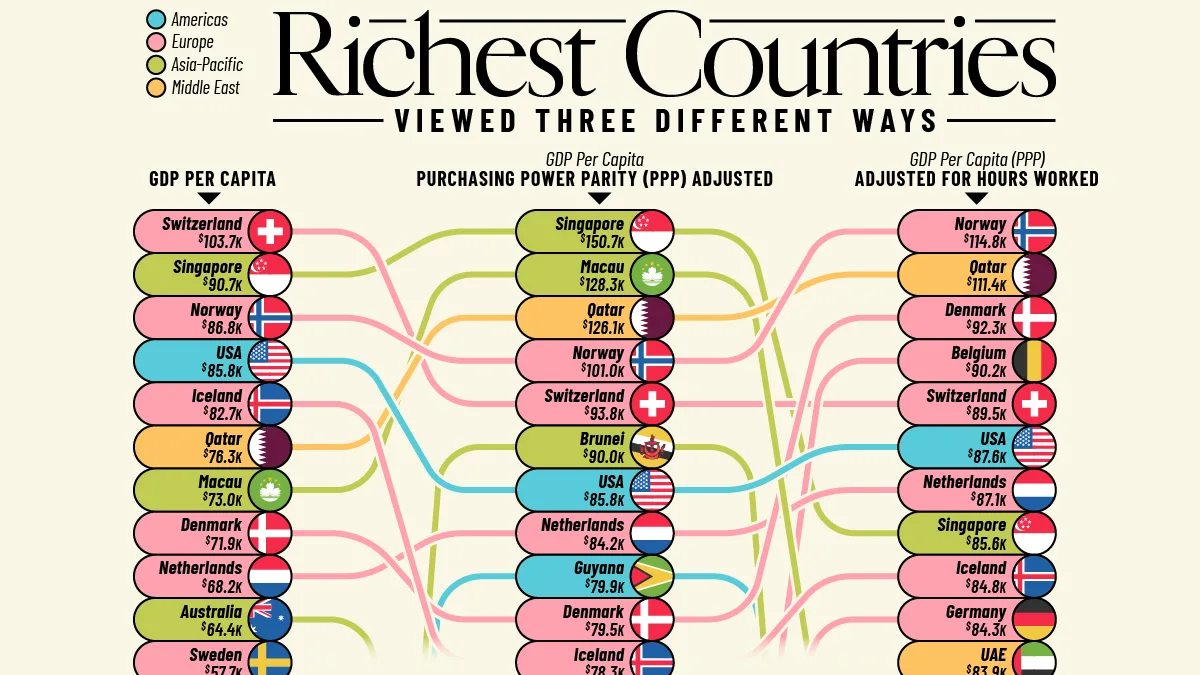
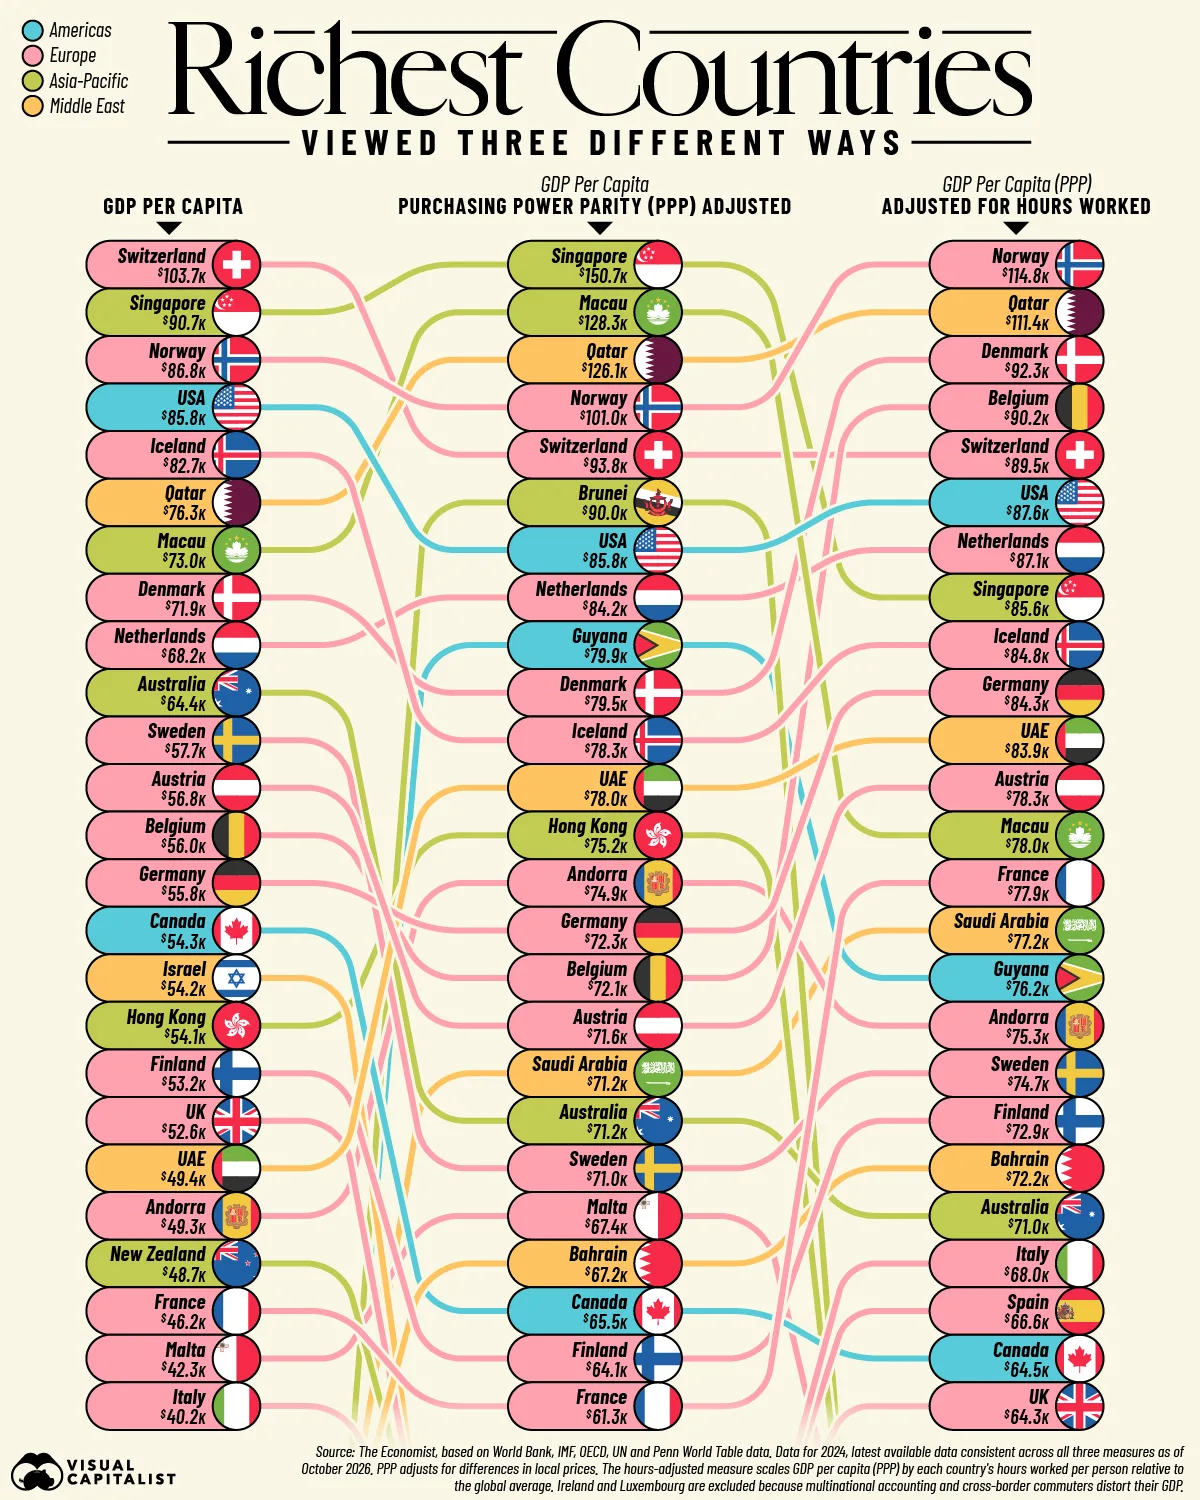
This graphic compares the top 25 countries and territories under three measures using The Economist’s 2025 dataset of 2024 estimates, the latest year of consistently comparable data across all three metrics.
These figures measure economic production per person rather than salaries or household wealth. Purchasing power parity (PPP) accounts for differences in local prices, while the final measure also adjusts for hours worked per resident relative to the global average.
Switzerland Leads in Nominal GDP per Capita
Switzerland tops the nominal GDP per capita ranking at $103,670, followed by Singapore at $90,674 and Norway at $86,810. These figures convert national output into U.S. dollars at market exchange rates, without adjusting for local prices.
The table below shows the top 25 countries and territories by nominal GDP per capita in 2024:
| Rank | Country or Territory | GDP per Capita (USD) |
|---|---|---|
| 1 |  Switzerland Switzerland |
103,670 |
| 2 |  Singapore Singapore |
90,674 |
| 3 |  Norway Norway |
86,810 |
| 4 |  U.S. U.S. |
85,810 |
| 5 |  Iceland Iceland |
82,704 |
| 6 |  Qatar Qatar |
76,276 |
| 7 |  Macau Macau |
73,047 |
| 8 |  Denmark Denmark |
71,852 |
| 9 |  Netherlands Netherlands |
68,219 |
| 10 |  Australia Australia |
64,407 |
| 11 |  Sweden Sweden |
57,723 |
| 12 |  Austria Austria |
56,833 |
| 13 |  Belgium Belgium |
55,955 |
| 14 |  Germany Germany |
55,800 |
| 15 |  Canada Canada |
54,283 |
| 16 |  Israel Israel |
54,177 |
| 17 |  Hong Kong Hong Kong |
54,107 |
| 18 |  Finland Finland |
53,189 |
| 19 |  UK UK |
52,637 |
| 20 |  UAE UAE |
49,378 |
| 21 |  Andorra Andorra |
49,304 |
| 22 |  New Zealand New Zealand |
48,747 |
| 23 |  France France |
46,150 |
| 24 |  Malta Malta |
42,347 |
| 25 |  Italy Italy |
40,226 |
The U.S. places fourth at $85,810, behind three much smaller economies. Dividing output by population produces a different ranking from comparing the size of entire economies.
Ireland and Luxembourg, along with small island territories, are excluded from The Economist’s rankings because multinational accounting and cross-border commuting can distort GDP per resident.
Singapore Takes First Place After Adjusting for Purchasing Power
Accounting for local prices puts Singapore first at $150,689 in PPP-adjusted dollars. Macau follows at $128,268 and Qatar at $126,110.
The table below ranks the top 25 countries and territories by GDP per capita at purchasing power parity in 2024:
| Rank | Country or Territory | GDP per Capita (PPP Dollars) |
|---|---|---|
| 1 | Singapore |
150,689 |
| 2 | Macau |
128,268 |
| 3 | Qatar |
126,110 |
| 4 | Norway |
101,032 |
| 5 | Switzerland |
93,819 |
| 6 |  Brunei Brunei |
90,007 |
| 7 | U.S. |
85,810 |
| 8 | Netherlands |
84,218 |
| 9 |  Guyana Guyana |
79,906 |
| 10 | Denmark |
79,514 |
| 11 | Iceland |
78,259 |
| 12 | UAE |
77,959 |
| 13 | Hong Kong |
75,216 |
| 14 | Andorra |
74,939 |
| 15 | Germany |
72,300 |
| 16 | Belgium |
72,126 |
| 17 | Austria |
71,618 |
| 18 |  Saudi Arabia Saudi Arabia |
71,243 |
| 19 | Australia |
71,193 |
| 20 | Sweden |
71,030 |
| 21 | Malta |
67,364 |
| 22 |  Bahrain Bahrain |
67,211 |
| 23 | Canada |
65,463 |
| 24 | Finland |
64,091 |
| 25 | France |
61,322 |
Switzerland falls to fifth at $93,819, below its nominal figure. Singapore moves in the opposite direction, from $90,674 to $150,689. PPP values express output at a common price level, so the change reflects differences in local prices rather than an increase or decline in actual production.
Singapore has also climbed the global rankings over time. Over the past 20 years, it rose from ninth to second in GDP per capita adjusted for purchasing power parity.
Guyana makes an even larger jump between the measures, climbing from 38th in nominal GDP per capita ($29,884) to ninth on a PPP basis ($79,906). The U.S., meanwhile, falls from fourth to seventh, even though its figure stays at $85,810, since international dollars are benchmarked to U.S. purchasing power.
Norway Leads Once Working Hours Are Included
The final adjustment favors economies that generate high output relative to the hours their residents work. The Economist divides PPP-adjusted GDP per capita by hours worked per resident relative to the global average, lifting Norway to first at $114,804.
This adjustment highlights how rankings change when differences in working time are taken into account, rather than comparing economic output per resident alone.
The table below shows the top 25 countries and territories by PPP-adjusted GDP per capita, normalized for hours worked, in 2024:
| Rank | Country or Territory | Hours-Adjusted GDP per Capita (PPP Dollars) |
|---|---|---|
| 1 | Norway |
114,804 |
| 2 | Qatar |
111,369 |
| 3 | Denmark |
92,288 |
| 4 | Belgium |
90,179 |
| 5 | Switzerland |
89,471 |
| 6 | U.S. |
87,550 |
| 7 | Netherlands |
87,117 |
| 8 | Singapore |
85,552 |
| 9 | Iceland |
84,803 |
| 10 | Germany |
84,325 |
| 11 | UAE |
83,932 |
| 12 | Austria |
78,338 |
| 13 | Macau |
78,043 |
| 14 | France |
77,897 |
| 15 | Saudi Arabia |
77,213 |
| 16 | Guyana |
76,160 |
| 17 | Andorra |
75,299 |
| 18 | Sweden |
74,658 |
| 19 | Finland |
72,896 |
| 20 | Bahrain |
72,165 |
| 21 | Australia |
70,970 |
| 22 | Italy |
67,985 |
| 23 |  Spain Spain |
66,630 |
| 24 | Canada |
64,508 |
| 25 | UK |
64,338 |
Belgium rises from 16th in the PPP ranking ($72,126) to fourth after adjusting for hours ($90,179). France also advances, from 25th ($61,322) to 14th ($77,897).
Singapore falls from first to eighth, with its adjusted value dropping from $150,689 to $85,552. Its high output per resident is accompanied by more hours worked per resident than the global average.
Ultimately, the richest country depends on what you’re trying to measure. GDP per capita offers a useful snapshot of economic output, but differences in prices and working hours provide important context.
Learn More on the Voronoi App
If you enjoyed today’s post, check out Ranked: The Countries Where $1,000 Takes the Longest to Earn on Voronoi.