Which Cities Offer the Best Quality of Life for the Cost?
Key Takeaways:
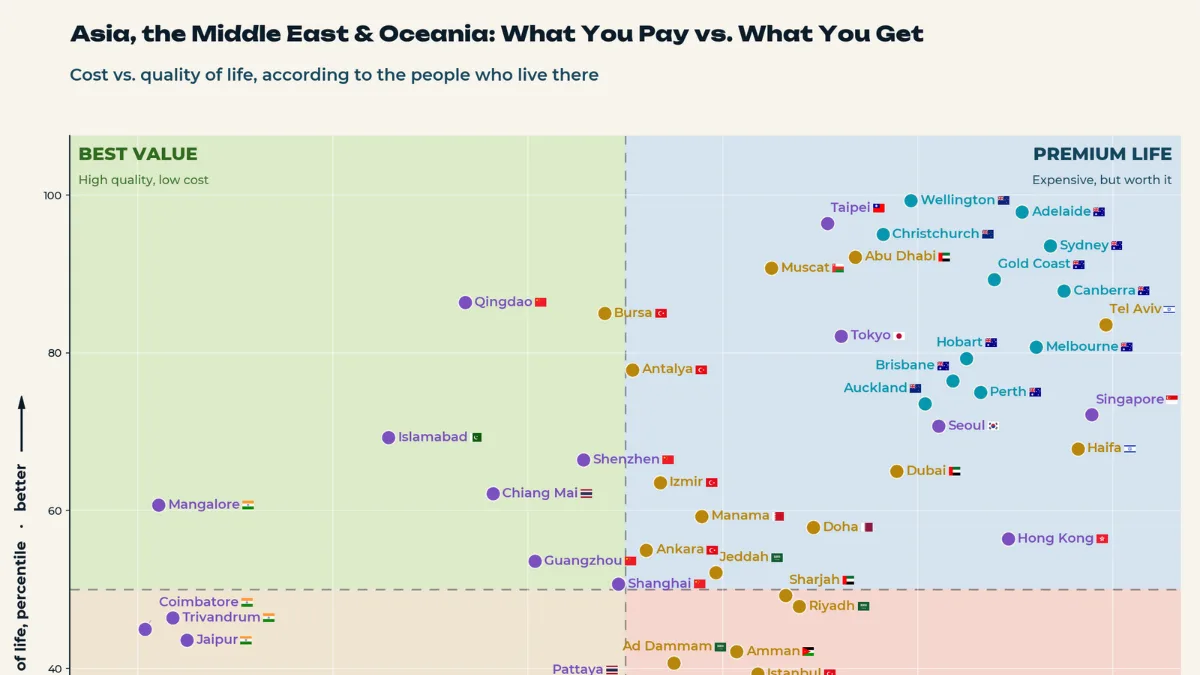
- Qingdao stands out for value, combining a Quality of Life Index of 184.3 with a Cost of Living Index of just 30.6.
- Christchurch leads all 70 cities on Numbeo’s raw Quality of Life Index at 190.5, followed by Brisbane at 189.7.
- Beirut’s Cost of Living Index of 56.6 exceeds Muscat’s 48.8, despite having a substantially lower quality-of-life score.
Higher living costs don’t always translate into better living standards. Across Asia, the Middle East, and Oceania, some relatively affordable cities outperform more expensive destinations on quality of life.
This visualization by Valerii Emelianov compares 70 cities using August 2026 data from Numbeo’s Quality of Life Rankings. The chart uses regional percentiles, excluding price-linked factors from its quality-of-life measure, while the table includes Numbeo’s original index scores.
Where Does Quality of Life Outweigh Cost?
The table below compares cost-of-living and quality-of-life scores across 70 cities, based on Numbeo data.
| City | Cost of Living Percentile | Livability Percentile | Cost of Living Index | Quality of Life Index |
|---|---|---|---|---|
 Qingdao |
33.6 | 86.4 | 30.6 | 184.3 |
 Islamabad |
25.7 | 69.3 | 25.9 | 141.3 |
 Bursa |
47.9 | 85.0 | 39.6 | 169.5 |
 Mangalore |
2.1 | 60.7 | 18.0 | 147.0 |
| Antalya |
50.7 | 77.9 | 41.7 | 162.0 |
 Muscat |
65.0 | 90.7 | 48.8 | 180.9 |
 Taipei |
70.7 | 96.4 | 54.5 | 157.2 |
 Chiang Mai |
36.4 | 62.1 | 32.9 | 136.9 |
| Shenzhen |
45.7 | 66.4 | 39.1 | 153.3 |
 Abu Dhabi |
73.6 | 92.1 | 55.6 | 183.2 |
 Christchurch |
76.4 | 95.0 | 61.3 | 190.5 |
 Tokyo |
72.1 | 82.1 | 55.5 | 176.4 |
| Izmir |
53.6 | 63.6 | 44.0 | 154.4 |
| Thiruvananthapuram |
3.6 | 46.4 | 18.5 | 122.8 |
| Coimbatore |
0.7 | 45.0 | 17.4 | 134.9 |
| Wellington |
79.3 | 99.3 | 68.5 | 186.1 |
| Jaipur |
5.0 | 43.6 | 19.3 | 132.6 |
| Guangzhou |
40.7 | 53.6 | 37.3 | 138.8 |
 Manama |
57.9 | 59.3 | 45.8 | 174.4 |
| Ankara |
52.1 | 55.0 | 42.3 | 146.1 |
| Lahore |
12.1 | 33.6 | 21.8 | 99.9 |
| Shanghai |
49.3 | 50.7 | 41.0 | 132.3 |
| Ahmedabad |
10.7 | 32.1 | 21.7 | 132.1 |
| Pune |
19.3 | 35.0 | 22.5 | 159.3 |
| Hyderabad |
14.3 | 29.3 | 21.9 | 169.6 |
| Auckland |
80.7 | 73.6 | 68.6 | 177.4 |
| Chennai |
7.9 | 22.1 | 20.5 | 134.5 |
 Jeddah |
59.3 | 52.1 | 46.1 | 156.4 |
 Hanoi |
29.3 | 30.7 | 28.7 | 91.1 |
 Doha |
69.3 | 57.9 | 53.2 | 173.7 |
| Dubai |
77.9 | 65.0 | 63.0 | 166.5 |
 Brisbane |
83.6 | 76.4 | 71.5 | 189.7 |
 Kathmandu |
23.6 | 25.0 | 24.5 | 83.0 |
| Bangalore |
17.9 | 17.9 | 22.1 | 129.3 |
| Kolkata |
6.4 | 10.7 | 20.0 | 98.7 |
| Adelaide |
90.7 | 97.9 | 79.5 | 189.2 |
| Mumbai |
25.7 | 15.0 | 25.9 | 94.1 |
| Pattaya |
42.1 | 37.9 | 38.6 | 101.7 |
 Colombo |
37.9 | 26.4 | 34.7 | 60.7 |
 Seoul |
82.1 | 70.7 | 71.1 | 159.8 |
| Noida |
9.3 | 6.4 | 21.0 | 129.5 |
| Gurgaon |
22.1 | 12.1 | 24.4 | 110.6 |
| Beijing |
43.6 | 36.4 | 38.9 | 117.7 |
| Karachi |
16.4 | 9.3 | 22.0 | 74.9 |
| Ho Chi Minh City |
30.7 | 13.6 | 30.0 | 74.7 |
| Delhi |
14.3 | 2.1 | 21.9 | 89.6 |
 Tehran |
20.7 | 7.9 | 23.2 | 71.6 |
 Cebu |
35.0 | 16.4 | 32.6 | 69.1 |
| Sydney |
93.6 | 93.6 | 83.0 | 182.0 |
| Gold Coast |
87.9 | 89.3 | 79.0 | 188.9 |
| Sharjah |
66.4 | 49.3 | 50.3 | 149.8 |
 Dhaka |
27.9 | 0.7 | 26.1 | 52.8 |
 Jakarta |
32.1 | 5.0 | 30.1 | 72.7 |
| Hobart |
85.0 | 79.3 | 77.3 | 189.1 |
| Ad Dammam |
55.0 | 40.7 | 44.5 | 148.9 |
| Riyadh |
67.9 | 47.9 | 50.5 | 152.5 |
 Kuala Lumpur |
45.7 | 23.6 | 39.1 | 135.2 |
 Amman |
61.4 | 42.1 | 46.5 | 122.1 |
| Canberra |
95.0 | 87.9 | 83.9 | 186.9 |
| Perth |
86.4 | 75.0 | 77.9 | 188.1 |
| Melbourne |
92.1 | 80.7 | 80.4 | 189.2 |
| Istanbul |
63.6 | 39.3 | 47.3 | 127.1 |
| Manila |
39.3 | 3.6 | 35.1 | 52.2 |
| Bangkok |
56.4 | 27.9 | 44.7 | 80.6 |
 Tel Aviv-Yafo |
99.3 | 83.6 | 106.8 | 160.5 |
 Kuwait City |
61.4 | 19.3 | 46.5 | 134.7 |
 Singapore |
97.9 | 72.1 | 93.0 | 152.7 |
| Haifa |
96.4 | 67.9 | 89.1 | 181.1 |
 Beirut |
75.0 | 20.7 | 56.6 | 90.4 |
 Hong Kong |
89.3 | 56.4 | 79.3 | 120.5 |
The contrast between Qingdao and Singapore is striking.
Singapore’s Cost of Living Index reaches 93.0, more than three times Qingdao’s 30.6, despite having a lower Quality of Life Index of 152.7 versus 184.3.
Why Similar Living Costs Can Mean Very Different Lives
Muscat records a Quality of Life Index of 180.9, compared with 152.5 in Riyadh and 134.7 in Kuwait City. Yet their respective cost indices are relatively close at 48.8, 50.5, and 46.5.
Differences in pollution, commuting, healthcare, and safety can help explain why similar living costs produce different outcomes. These factors also highlight why rapid economic growth across Asia does not necessarily guarantee better daily living conditions. Islamabad, for example, combines relatively low living costs with a strong quality-of-life score.
By contrast, cities including Manila and Dhaka struggle on the chart’s quality-of-life measure, reflecting how urban pressures can outweigh the advantages of affordability. Beirut presents another striking contrast, with a Quality of Life Index of just 90.4 despite a Cost of Living Index of 56.6. Economic instability and pressure on public infrastructure can weaken the benefits residents receive from their spending.
Beyond income, social connections, environmental quality, and access to essential services influence residents’ well-being. As Greenpeace MENA’s analysis of happiness in the region emphasizes, stronger communities and healthier environments are important components of well-being that economic indicators alone cannot capture.
Oceania’s High-Cost, High-Quality Tradeoff
Christchurch leads the dataset’s raw quality-of-life scores at 190.5, with a Cost of Living Index of 61.3. Adelaide follows closely on quality of life at 189.2 but has a considerably higher cost index of 79.5.
Strong healthcare systems, infrastructure, and environmental conditions help explain Oceania’s performance. However, high housing costs remain an important tradeoff, particularly when comparing the world’s leading cities for quality of life.
Ultimately, the best value depends on more than affordability alone. While cities such as Christchurch and Adelaide offer some of the highest quality-of-life scores, lower-cost destinations demonstrate that strong living standards don’t always require a premium price tag.
Learn More on the Voronoi App
Explore How Quality of Life Has Changed in 30 Countries, According to Citizens to see how perceptions of living standards have evolved worldwide.
- Source: https://www.visualcapitalist.com/cp/ranked-cities-in-asia-and-oceania-quality-of-life-vs-cost/