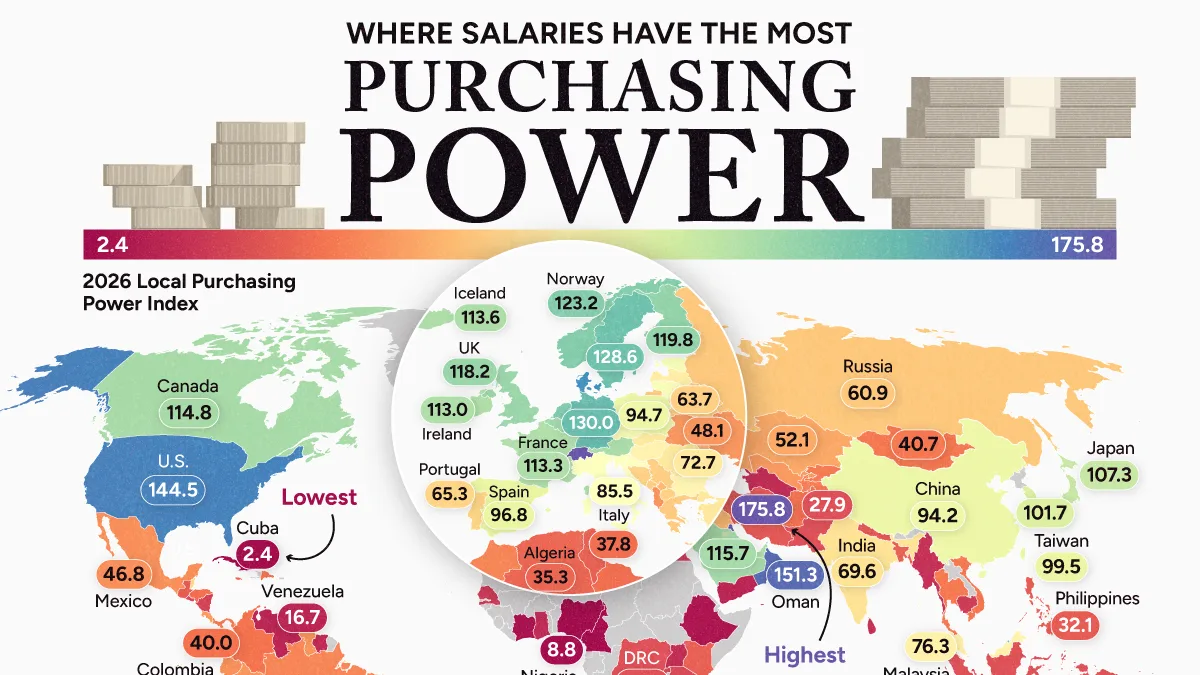
Where Does Your Salary Go the Furthest in 2026?
Key Takeaways
- Kuwait ranks first in 2026, where average salaries buy the most goods and services at local prices.
- The U.S. ranks sixth, with salaries offering 26% more purchasing power than in Canada.
- Cuba ranks last, followed by Syria and Nigeria, where wages buy the least at local prices.
A higher salary doesn’t always mean greater purchasing power. As housing, food, and other everyday expenses put pressure on household budgets, what matters is how much a paycheck can actually buy.
This visualization uses data from Numbeo to compare salary purchasing power across 142 countries in 2026. The index measures average take-home salaries relative to local prices, using New York City as a benchmark of 100.
Where Salaries Go the Furthest in 2026
The following table ranks countries by how much average take-home pay can buy at local prices. Higher scores indicate greater purchasing power.
| Rank | Country | Local Purchasing Power Index (2026) |
|---|---|---|
| 1 |  Kuwait |
175.8 |
| 2 |  Qatar |
168.1 |
| 3 |  Switzerland |
165.7 |
| 4 |  Luxembourg |
155.1 |
| 5 |  Oman |
151.3 |
| 6 |  U.S. |
144.5 |
| 7 |  Denmark |
141.2 |
| 8 |  Australia |
134.8 |
| 9 |  Germany |
130.0 |
| 10 |  Sweden |
128.6 |
| 11 |  Brunei |
128.0 |
| 12 |  Netherlands |
124.3 |
| 13 |  Norway |
123.2 |
| 14 |  Finland |
119.8 |
| 15 |  New Zealand |
119.4 |
| 16 |  UK |
118.2 |
| 17 |  Bahrain |
117.3 |
| 18 |  Belgium |
117.1 |
| 19 |  Saudi Arabia |
115.7 |
| 20 |  Israel |
115.0 |
| 21 |  Canada |
114.8 |
| 22 |  Austria |
114.2 |
| 23 |  Iceland |
113.6 |
| 24 |  UAE |
113.4 |
| 25 |  France |
113.3 |
| 26 |  Ireland |
113.0 |
| 27 |  Japan |
107.3 |
| 28 |  South Africa |
105.5 |
| 29 |  South Korea |
101.7 |
| 30 |  Taiwan |
99.5 |
| 31 |  Spain |
96.8 |
| 32 |  Poland |
94.7 |
| 33 |  China |
94.2 |
| 34 |  Singapore |
91.3 |
| 35 |  Czechia |
89.2 |
| 36 |  Estonia |
88.7 |
| 37 |  Lithuania |
87.5 |
| 38 |  Slovenia |
87.0 |
| 39 |  Italy |
85.5 |
| 40 |  Croatia |
82.0 |
| 41 |  Cyprus |
81.3 |
| 42 |  Botswana |
80.0 |
| 43 |  Bulgaria |
78.6 |
| 44 |  Hungary |
77.3 |
| 45 |  Malta |
76.6 |
| 46 |  Malaysia |
76.3 |
| 47 |  Latvia |
74.1 |
| 48 |  Slovakia |
73.4 |
| 49 |  Romania |
72.7 |
| 50 |  Turkey |
71.8 |
| 51 |  India |
69.6 |
| 52 |  Namibia |
69.0 |
| 53 |  Belize |
65.4 |
| 54 |  Portugal |
65.3 |
| 55 |  North Macedonia |
64.6 |
| 56 |  Bosnia and Herzegovina |
64.3 |
| 57 |  Belarus |
63.7 |
| 58 |  Montenegro |
63.4 |
| 59 |  Serbia |
63.1 |
| 60 |  Greece |
62.3 |
| 61 |  Russia |
60.9 |
| 62 |  Bahamas |
58.5 |
| 63 |  Iraq |
57.6 |
| 64 |  Uruguay |
56.8 |
| 65 |  Fiji |
56.4 |
| 66 |  Kosovo |
56.4 |
| 67 |  Moldova |
55.6 |
| 68 |  Jordan |
55.3 |
| 69 |  Mauritius |
54.1 |
| 70 |  Kazakhstan |
52.1 |
| 71 |  Chile |
50.4 |
| 72 |  Costa Rica |
49.1 |
| 73 |  Paraguay |
49.1 |
| 74 |  Uzbekistan |
48.6 |
| 75 |  Peru |
48.4 |
| 76 |  Ukraine |
48.1 |
| 77 |  Guyana |
47.9 |
| 78 |  Armenia |
47.4 |
| 79 |  Ecuador |
47.4 |
| 80 |  Albania |
46.9 |
| 81 |  Mexico |
46.8 |
| 82 |  Argentina |
44.8 |
| 83 |  Brazil |
44.3 |
| 84 |  Morocco |
43.7 |
| 85 |  Georgia |
43.2 |
| 86 |  Bolivia |
43.1 |
| 87 |  Trinidad and Tobago |
42.7 |
| 88 |  Tajikistan |
42.4 |
| 89 |  Panama |
42.1 |
| 90 |  Kyrgyzstan |
41.6 |
| 91 |  Thailand |
41.0 |
| 92 |  Mongolia |
40.7 |
| 93 |  Vietnam |
40.5 |
| 94 |  Dominican Republic |
40.4 |
| 95 |  Colombia |
40 |
| 96 |  Azerbaijan |
39.8 |
| 97 |  Maldives |
38.9 |
| 98 |  Honduras |
38.9 |
| 99 |  Afghanistan |
38.5 |
| 100 |  Libya |
37.8 |
| 101 |  Lebanon |
35.6 |
| 102 |  Algeria |
35.3 |
| 103 |  Jamaica |
34.6 |
| 104 |  Tunisia |
33.6 |
| 105 |  Kenya |
33.4 |
| 106 |  Guatemala |
32.8 |
| 107 |  Bangladesh |
32.8 |
| 108 |  Philippines |
32.1 |
| 109 |  Seychelles |
31.5 |
| 110 |  Iran |
30.7 |
| 111 |  Nepal |
29.9 |
| 112 |  Indonesia |
28.5 |
| 113 |  Democratic Republic of the Congo |
28.2 |
| 114 |  Pakistan |
27.9 |
| 115 |  Zimbabwe |
27.8 |
| 116 |  El Salvador |
26.8 |
| 117 |  Tanzania |
26.1 |
| 118 |  Rwanda |
24.8 |
| 119 |  Nicaragua |
24.6 |
| 120 |  Mozambique |
24.3 |
| 121 |  Egypt |
23.9 |
| 122 |  Zambia |
23.5 |
| 123 |  Cambodia |
22.6 |
| 124 |  Senegal |
22.3 |
| 125 |  Cape Verde |
22.3 |
| 126 |  Papua New Guinea |
20.2 |
| 127 |  Sri Lanka |
19.7 |
| 128 |  Myanmar |
19.5 |
| 129 |  Uganda |
18.6 |
| 130 |  Turkmenistan |
18.5 |
| 131 |  Suriname |
18.4 |
| 132 |  Ghana |
18.1 |
| 133 |  Venezuela |
16.7 |
| 134 |  Yemen |
16.6 |
| 135 |  Madagascar |
14.9 |
| 136 |  Solomon Islands |
13.2 |
| 137 |  Ethiopia |
12.5 |
| 138 |  Côte d’Ivoire |
11.7 |
| 139 |  Cameroon |
10.8 |
| 140 |  Nigeria |
8.8 |
| 141 |  Syria |
6.4 |
| 142 |  Cuba |
2.4 |
| — | New York City (Benchmark) |
100.0 |
Four of the five countries where salaries stretch furthest have populations below 10 million. Kuwait and Qatar lead the rankings, while Switzerland and Luxembourg also place in the top five. Oman rounds out the top five, ahead of the U.S., the world’s largest economy.
At the opposite extreme, Cuba has a purchasing power index of just 2.4, roughly 73 times lower than Kuwait’s. This highlights the enormous differences in what an average paycheck can buy across countries.
Why American Salaries Go Further Than Canadian Salaries
The purchasing power gap between the U.S. and Canada is particularly striking given the relatively high living costs in both countries.
The difference is reinforced by wage data. In 2025, average annual wages reached $86,977 in the U.S., compared with $67,901 in Canada, after adjusting for differences in local prices. That’s a 28% advantage for American workers.
Although these figures represent gross wages while Numbeo uses take-home pay, both comparisons point to a similar conclusion: the U.S. wage advantage persists even after accounting for differences in living costs.
Why Cuba Has the World’s Weakest Purchasing Power
In 2025, the average monthly state salary in Cuba was 6,930 Cuban pesos, equivalent to roughly $13 at the informal exchange rate reported in April 2026.
The country’s state-dominated wage system and depreciating currency have severely weakened household purchasing power. Food shortages, shrinking subsidized rations, and frequent power outages have compounded the pressure on households.
Why High Living Costs Don’t Always Mean Less Buying Power
Switzerland ranks third worldwide, despite being one of Europe’s most expensive countries. Portugal, where living costs are considerably lower, ranks 54th. Average salaries in Switzerland offer roughly 2.5 times the purchasing power of those in Portugal.
Oman offers another surprising example. Ranking fifth globally, ahead of the U.S., Denmark, and Australia, its strong salaries, absence of personal income tax, and relatively low living costs help explain why paychecks stretch further in the oil-rich economy.
These comparisons highlight why affordability depends on both earnings and expenses. Countries with high living costs can still offer strong purchasing power when local wages are high enough to offset them.
Learn More on the Voronoi App
To learn more about this topic, check out this graphic showing how inflation has eroded the purchasing power of $100 since 2019, by country.