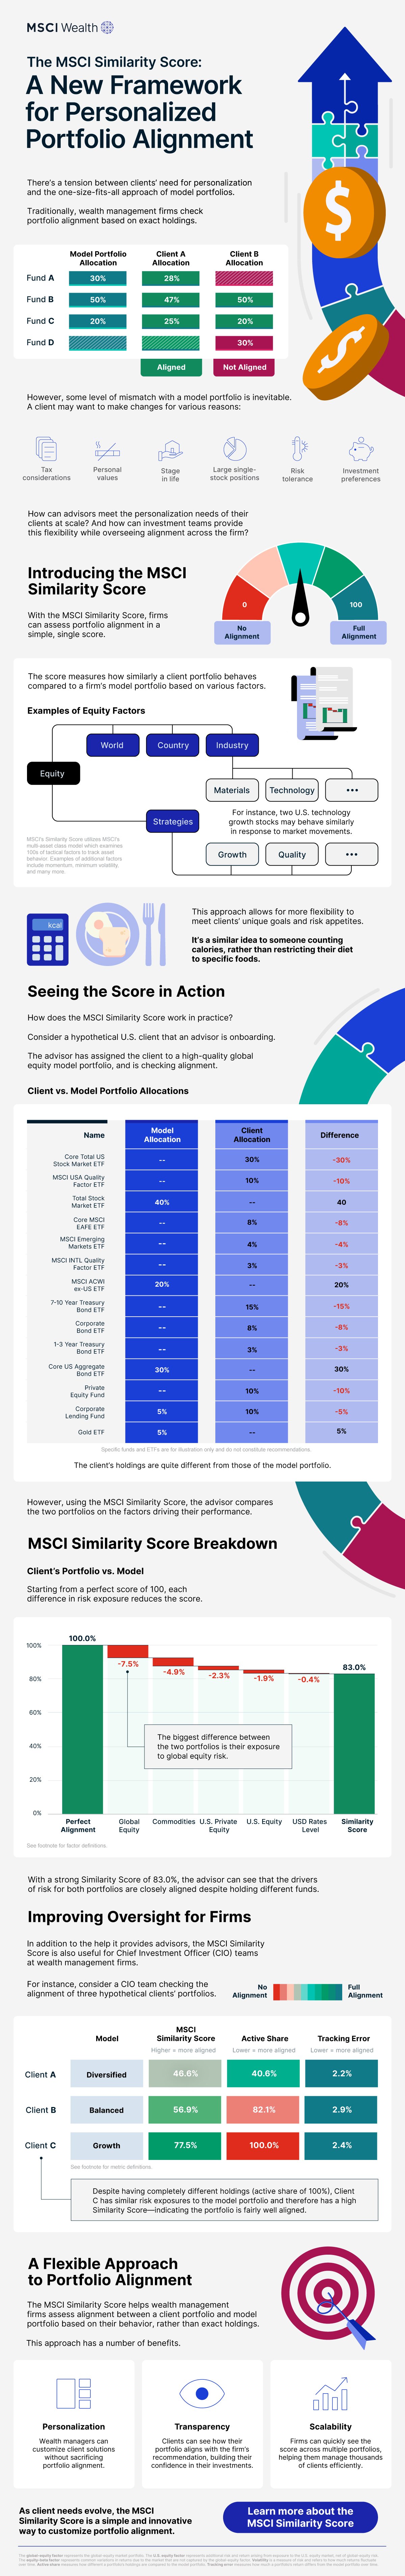
A New Framework for Personalized Financial Portfolio Alignment
There’s a tension between clients’ need for personalization and the one-size-fits-all approach of model portfolios. Traditionally, wealth management firms check financial portfolio alignment based on exact holdings. However, some level of mismatch with a model portfolio is inevitable due to client preferences and circumstances.
How can advisors meet the personalization needs of their clients at scale?
This graphic, created in partnership with MSCI Wealth, highlights a new framework called the MSCI Similarity Score that allows for customization.
Introducing the MSCI Similarity Score
With the MSCI Similarity Score, firms can assess financial portfolio alignment in a simple, single score. A score of 0 indicates no alignment, while a score of 100 indicates full alignment.
The score measures how similarly a client portfolio behaves compared to a firm’s model portfolio based on various factors. For equity, this includes things like the country and industry of a company, as well as the strategies used, such as targeting growth stocks. For instance, two U.S. technology growth stocks may behave similarly in response to market movements.
This approach allows for more flexibility to meet clients’ unique goals and risk appetites. It’s a similar idea to someone counting calories, rather than restricting their diet to specific foods.
Seeing the Score in Action
How does the MSCI Similarity Score work in practice? Consider a hypothetical U.S. client that an advisor is onboarding.
The advisor has assigned the client to a high-quality global equity model portfolio, and is checking alignment.
| Name | Model Allocation | Client Allocation | Difference |
|---|---|---|---|
| Core Total US Stock Market ETF | — | 30% | -30% |
| MSCI USA Quality Factor ETF | — | 10% | -10% |
| Total Stock Market ETF | 40% | — | 40% |
| Core MSCI EAFE ETF | — | 8% | -8% |
| MSCI Emerging Markets ETF | — | 4% | -4% |
| MSCI INTL Quality Factor ETF | — | 3% | -3% |
| MSCI ACWI ex-US ETF | 20% | — | 20% |
| 7-10 Year Treasury Bond ETF | — | 15% | -15% |
| Corporate Bond ETF | — | 8% | -8% |
| 1-3 Year Treasury Bond ETF | — | 3% | -3% |
| Core US Aggregate Bond ETF | 30% | — | 30% |
| Private Equity Fund | — | 10% | -10% |
| Corporate Lending Fund | 5% | 10% | -5% |
| Gold ETF | 5% | — | 5% |
Specific funds and ETFs are for illustration only and do not constitute recommendations.
The client’s holdings are quite different from those of the model portfolio.
However, using the MSCI Similarity Score, the advisor compares the two portfolios on the factors driving their performance.
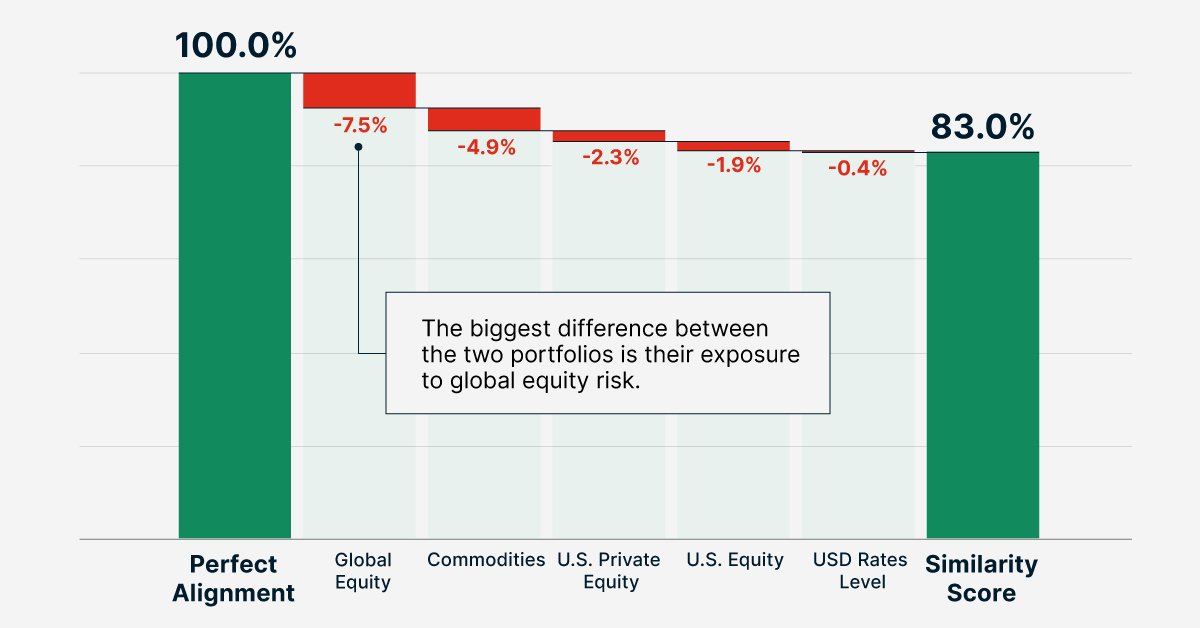
MSCI Similarity Score Breakdown
Starting from a perfect score of 100, each difference in risk exposure between the client’s portfolio and the model portfolio reduces the score.
| Risk Factor | Score |
|---|---|
| Starting Point: Perfect Alignment | 100.0% |
| Global Equity | -7.5% |
| Commodities | -4.9% |
| US Private Equity | -2.3% |
| U.S. Equity | -1.9% |
| USD Rates Level | -0.4% |
| Final Similarity Score | 83.0% |
The biggest difference between the two portfolios is their exposure to global equity risk.
With a strong Similarity Score of 83.0%, the advisor can see that the drivers of risk for both portfolios are closely aligned despite holding different funds.
A Flexible Approach to Financial Portfolio Alignment
The MSCI Similarity Score helps wealth management firms assess alignment between a client portfolio and model portfolio based on their behavior, rather than exact holdings.
This approach has a number of benefits.
- Personalization: Wealth managers can customize client solutions without sacrificing portfolio alignment.
- Transparency: Clients can see how their financial portfolio aligns with the firm’s recommendation, building their confidence in their investments.
- Scalability: Firms can quickly see the score across multiple portfolios, helping them manage thousands of clients efficiently.
As client needs evolve, the MSCI Similarity Score is a simple and innovative way to customize financial portfolio alignment.

Learn more about the MSCI Similarity Score.
-
 Stocks7 months ago
The S&P 500 Makes Up 51% of Global Stock Market Value
See a unique visual breakdown of the global equity market in this infographic.
-
 Investor Education7 months ago
Visualizing S&P 500 Performance by Presidential Year
We visualized historical data since November 1980 to uncover average S&P 500 performance by presidential year.
-
 Stocks7 months ago
Infographic: How Many Active Funds Beat the S&P 500?
We visualized over 20 years of history to see how many active funds were able to beat the S&P 500.
-
 Money2 years ago
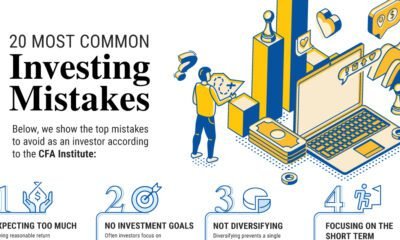
The 20 Most Common Investing Mistakes, in One Chart
Here are the most common investing mistakes to avoid, from emotionally-driven investing to paying too much in fees.
-
 Stocks2 years ago
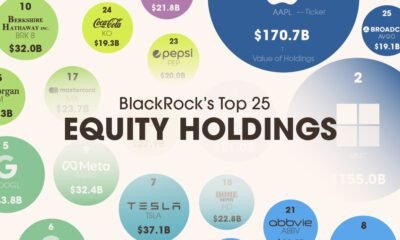
Visualizing BlackRock’s Top Equity Holdings
BlackRock is the world’s largest asset manager, with over $9 trillion in holdings. Here are the company’s top equity holdings.
-
 Investor Education2 years ago
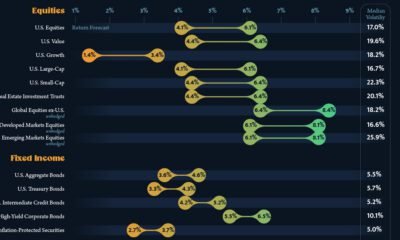
10-Year Annualized Forecasts for Major Asset Classes
This infographic visualizes 10-year annualized forecasts for both equities and fixed income using data from Vanguard.
- Source: https://www.visualcapitalist.com/sp/msci06-framework-for-personalized-financial-portfolio-alignment/


var disqus_shortname = “visualcapitalist.disqus.com”;
var disqus_title = “A New Framework for Personalized Financial Portfolio Alignment”;
var disqus_url = “https://www.visualcapitalist.com/sp/msci06-framework-for-personalized-financial-portfolio-alignment/”;
var disqus_identifier = “visualcapitalist.disqus.com-178507”;