The day I was supposed to join a group of young women to map Gros Islet, an old fishing village on the Caribbean Island of St. Lucia, I got lost. Proann Francis, who was helping lead the expedition, had told me to meet everyone at Care Growell School, which Google Maps informed me was some 8,500 miles away, in Uttar Pradesh, India. “Where?” I asked. She instructed me to wait outside my hotel for a ride because it would be impossible to find the place on my own. An hour later, I found myself standing at the side of a dusty St. Lucian highway as a vintage red Toyota van pulled up. I squeezed in, between Francis and the driver. Behind us, a group of young women sat wearing matching light blue shirts that read “Women Mappers.”
“We have some heavy mapping to do today!” Francis announced, breaking into a toothy smile, her dark hair pulled back neatly into a bun.
Most of St. Lucia, which sits at the southern end of an archipelago stretching from Trinidad and Tobago to the Bahamas, is poorly mapped. Aside from strips of sandy white beaches that hug the coastline, the island is draped with dense rainforest. A few green signs hang limp and faded from utility poles like an afterthought, identifying streets named during more than a century of dueling British and French colonial rule. One major road, Micoud Highway, runs like a vein from north to south, carting tourists from the airport to beachfront resorts. Little of this is accurately represented on Google Maps. Almost nobody uses, or has, a conventional address. Locals orient one another with landmarks: the red house on the hill, the cottage next to the church, the park across from Care Growell School.
Our van wound off Micoud Highway into an empty lot beneath the shade of a banana tree. A dog panted, belly up, under the hot November sun. The group had been recruited by the Humanitarian OpenStreetMap Team, or HOT, a nonprofit that uses an open-source data platform called OpenStreetMap to create a map of the world that resembles Google’s with one key exception: Anyone can edit it, making it a sort of Wikipedia for cartographers.
The organization has an ambitious goal: Map the world’s unmapped places to help relief workers reach people when the next hurricane, fire, or other crisis strikes. Since its founding in 2010, some 340,000 volunteers around the world have been remotely editing OpenStreetMap to better represent the Caribbean, Southeast Asia, parts of Africa and other regions prone to natural disasters or humanitarian emergencies. In that time, they have mapped more than 2.1 million miles of roads and 156 million buildings. They use aerial imagery captured by drones, aircraft, or satellites to help trace unmarked roads, waterways, buildings, and critical infrastructure. Once this digital chart is more clearly defined, field-mapping expeditions like the one we were taking add the names of every road, house, church, or business represented by gray silhouettes on their paper maps. The effort fine-tunes the places that bigger players like Google Maps get wrong — or don’t get at all.
As we filed out of the bus, Christopher Williams, a consultant for the World Bank, stood waiting for us in a tangerine-colored polo, jeans, and gym shoes. He looked ready to trek through the Amazon, handing out bottles of water and clutching a stack of clipboards as everyone crowded around him. Each held a map, created with satellite images gleaned from Microsoft Bing, of the area we were about to walk. “OK, everyone,” Williams announced. He squinted at the document from behind square-framed glasses. “We just want to get a baseline of what is out there. What is the street layout, where are the houses, what are the types of businesses, what are their names? That’s pretty much it. Just map out what is there.”
Gros Islet village is a largely residential community. It sits at the northwestern tip of St. Lucia, hugged by dense forests to the east and the Caribbean to the west. There is little to protect from storms that race across the ocean. The last time the government counted, in 2020, 981 people lived there. Fewer live there today. Those who can afford to move to areas with better infrastructure.
“Where do we start?” Alaine Weeks asked as she examined her map, clutching a pen with 3-inch pink acrylic nails. Weeks, like the other women, were volunteers from the Youth Emergency Action Committee, which teaches young locals how to be first responders. The group has been at the forefront of these island expeditions, believing, as Francis explained to me, that its mission was to “do a good deed while having fun.”
“We’ll begin at the farthest point on the grid,” Williams told her, tracing his thumb over the perimeter of the map, where the sea met land. He divided the women into groups of three; each was assigned a section of the village. Soon, everyone splintered off in different directions. The charts they were supposed to complete covered about half a square mile of the village and a fraction of Gros Islet district, which is a little larger than Manhattan in New York City. Eventually, they hope to account for every foot of St. Lucia, which covers 238 square miles and includes more than a dozen peaks and ridges, broad valleys, and lush rainforest.
They are running out of time. Rising sea levels, dangerously high temperatures, and coastal erosion threaten the very existence of St. Lucia and other Caribbean islands, which are warming rapidly and experiencing sea level rise at rates as much as 67 percent faster than the global average, leading to more extreme weather. The climate crisis will only deepen, but maybe, with a more complete picture of the country’s geography, its most adverse outcomes can still be mitigated.

The central challenge in drawing an accurate map of the world has plagued cartographers for centuries: The world is spherical and paper is flat. They’ve tried and failed to get around this problem since the second century, when Ptolemy drew the first intelligible representation of the world in Geographia. His handiwork showed a lattice of blue oceans and bulges of undefined land, with more than half the world as we now know it missing. Its lines of latitude and longitude gestured toward a working scale of the planet — an attempt to think of Earth’s magnitude beyond what the eye could see. It would take many centuries before the full expanse of terra incognita came to light. As navigators sailed ever farther from shore and, later, airplanes took to the sky, once unknown features came into view. The Space Age widened the lens further as satellites allowed humanity to view Earth from the heavens. Still, the puzzle that stymied cartographers for millennia remained, raising the question of whether it would ever be possible to create a map so accurate as to represent reality itself.
Google was among the first to get around this. In 2001, a software startup called Keyhole developed an innovative approach to mapping. The California company combined a bunch of satellite and aerial images purchased from commercial suppliers, then chopped them up to create tiles a user could zoom in on. Rudimentary data from the two largest digital map providers at the time, TeleAtlas and NavTeq, helped with roads and addresses. The result was a truly interactive digital tool that allowed users to zoom, pan, and drag a 3D simulation of the world. Yet early iterations were flawed. The geospatial data they started with was not always of the best quality, and although Keyhole could provide a realistic sense of the Earth’s scale, users couldn’t always discern what they were zooming in on. “We had a very spotty Earth,” Brian McClendon, who co-founded Keyhole and was a Google vice president until 2015, told me.
Google acquired Keyhole in 2004 and used the company’s satellite imagery to help create a nascent version of Google Earth — whose core technology was integrated into what would become Google Maps. The acquisition led to a bigger budget, and the new Google team purchased higher-quality aerial imagery to get around the coverage problem. The following year, Google Maps used the technology to launch its first digital, interactive map, with the goal of helping “People get from Point A to Point B.” Within a few years, Google was flying planes over as much of the world as possible — excluding places like North Korea or China that didn’t allow them in their airspace — to create a live digital image of the world we live in.
This fundamentally changed the concept of mapping. “People had never seen satellite imagery before.” McClendon told me. “The most important thing that people got out of this was they could see their house, they could see how their space fit into the world. They could go to Iraq and see how the Iraqis were living.” The map data, however, was a disaster. While the app marked the first time anyone could see the entire planet, then zoom in on a particular city or town, the data that makes such a thing useful — the names of streets and roads and towns and buildings — was sparse and inaccurate. Entire towns were misidentified or even unidentified. Roads disappeared into an abyss. Earth could be seen from above, but not always from the ground up.
One day in 2004, McClendon recalled how Google executives Marissa Mayer, Sergey Brin, and Larry Page were driving around Stanford University when Page took out a camcorder and started recording. “Why can’t we do this?” Page asked them. Three years later, Google bolted a panoramic camera to the hood of a van and sent it to five cities, capturing spherical images every 30 feet or so. It worked, but it was slow and expensive. That led to “ball and stick” cameras mounted on hundreds of cars. Google dispatched some 100 drivers to cover every possible inch of the country. Entire towns that hadn’t been mapped began to appear on a scale that made it seem almost as if users were standing inside the map itself. Google named the feature Street View and today has covered over 10 million miles of roads.
The problem with trying to create a life-size digital version of the world is that the world is not static. “Mapping everywhere all the time in 3D, even today, is impossible,” McClendon said. “You have to make choices about what data to get and where to fly.” Google’s choices mostly came down to two priorities: population density and revenue. It focused resources where it enjoyed the easiest access: North America and much of Western Europe. Photographing streets in places like China or North Korea was impossible. It didn’t focus on countries like South Sudan or Cambodia because there was little profit to be made there. Until it started using AI and machine learning, the company relied on contractors to do much of the grunt work — just covering North America was a task that, in its first iteration, took 18 months. Today, the map is updated every second — more than 100 million updates made each day.
One of Google’s competitors, OpenStreetMap, took a different approach. The company, founded six months before Google Maps and launched by a physics student in London named Steve Coast, started with a simple question: What if a map were free and open to all? And what if it could be a collaborative effort involving people all over the world? When OpenStreetMap launched in 2005, it enjoyed immediate popularity in Western countries with access to the technology required to fill in the map.
Yet even as the modern, digitized representation of the world began coming together quickly, a fundamental cartographical inequity emerged. Street View provided excellent data in big cities and tourist destinations. OpenStreetMap was beloved by adventurers and hikers in Europe. But no one offered much data from developing nations or corners of the world that remained off the grid. But it was precisely in those kinds of places that the threat of disaster — intensified by climate change— was most severe. Who would map the spaces that remained terra incognita And how?
On January 12, 2010, a 7.0 magnitude earthquake ravaged Haiti, creating one of the worst humanitarian catastrophes to date. Rescue teams were ill-prepared. Maps of the country were imprecise, and with so many major landmarks destroyed, first responders had trouble orienting themselves even as aftershocks hit. By some estimates, a quarter of a million people died and at least four times that many were left homeless. Many of those displaced crowded into unsanitary, makeshift camps that led to a cholera epidemic, creating a crisis within the crisis.
That same day, Mikel Maron, a freelance software engineer who’d been involved with OpenStreetMap, or OSM, from its start, helped assemble a team. In the five years since Hurricane Katrina slammed into the Gulf Coast, he’d seen the humanitarian potential of OSM’s method — a way, as he put it to me, “to make a map that could be as dynamic as disasters are.” A friend who volunteered in New Orleans following the inundation noticed that the Red Cross was sending workers on a route where a bridge had been destroyed because it still existed on Google Maps, which was slow to incorporate updates. “At the time it was a really crazy idea to suggest that we use OpenStreetMap for disaster,” Maron told me. “OSM was a hacker project. We were still trying to figure out how to make it work — it wasn’t something you’d want to rely on in an emergency.”
But by the time the earthquake struck Haiti, the technology had become much more user-friendly. Word spread quickly and within two weeks some 600 volunteers around the world were contributing to a map that grew intricately detailed, like a spider spooling out its web. The challenge shifted to getting it into the hands of aid workers.
Ivan Gayton was in Port-au-Prince working for Doctors Without Borders when the cholera epidemic erupted. Gayton was overwhelmed. Clinics were flooded with desperate Haitians, their numbers multiplying faster than he could count. He’d never seen an epidemic of this scale before. His priority was to figure out how to stop the transmission. To do that, he needed to locate the source of the outbreak. It was standard to ask people who came into the clinic where they’d just come from, but he quickly realized that they lacked the tools and data to make use of any of the answers. When Gayton tried to pinpoint their responses on Google Maps, he drew a blank. Villages were improperly labeled, and aside from a few major highways, entire districts were a giant lacuna of pale yellow.
Then one day, a software engineer from Google brought a hard drive full of data generated by the nascent Humanitarian OpenStreetMap Team and introduced the mapping system to Gayton. “The trick to OSM was that it was wide open,” Gayton told me. “I could take the data and do what I wanted with it to get what I needed. That was demonstrably, evidence-based life saving.”
The tool also was surprisingly accurate after months of contributions. It provided proper names of many villages, districts, makeshift shelters, and hospitals. Like the British physician John Snow who, in 1854, used addresses of cholera victims and a map of London to trace the outbreak to a single contaminated pump, Gayton used a similar method to pinpoint clusters of cases. To his great surprise, it worked, and his team identified several transmission hot spots, including in a neighborhood called Mariani, a suburb of Port-au-Prince. “To this day I maintain that if we’d had a proper map of Haiti from the start,” Gayton said, “we could’ve stopped cholera dead.”
Not long after HOT’s official launch in 2010, some of the worst natural disasters of the century struck. Earthquakes throughout Asia and the Middle East. A typhoon in the Philippines. Major flooding, then major drought, in India. Wildfires in the Amazon. Hurricane Maria in the Caribbean. HOT’s small team found themselves inundated with requests from aid workers who needed better maps of the disaster zones. “We were basically running on a crisis-by-crisis model,” Kate Chapman, one of the startup’s co-founders, told me.
In its early days, HOT had just three full-time employees and about 20 contractors working in Indonesia. By 2015, the small organization had grown to around 11,000 online volunteers. Yet with so many crises hitting, it was difficult to measure their progress — or predict where the next emergency would strike. HOT’s team started collaborating with humanitarian organizations to find a way to work together when a disaster hit. “The question became, Could you map ahead of time?” Chapman explained. “Then that question became, What if we mapped ahead of time?”
Their projects grew more targeted, focusing not just on vulnerable and unmapped places, but on the specific issues facing communities in those places. In Tanzania in 2017, for example, HOT supported a local mapping group, Crowd2Map, to help young girls escape mandatory genital mutilation ceremonies. Its network of online cartographers identified buildings, roads, and villages in the Serengeti district where the illegal ceremonies often occurred. Over 277,000 buildings in the district were added to the map. According to The Guardian, the new map helped a legal aid worker locate a 16-year-old girl who was being held against her will in her home days before she was to be circumcised.
But there were too many places in the world that were on the brink of extreme poverty, civil war, and migration crises, as well as prone to climate disasters. HOT’s team realized that while it could start remote mapping projects anywhere, completing them required being on the ground. They would have to narrow their focus. But that, too, proved impossible. There were too many places that were poorly charted — 94 countries, the organization estimated in 2019, and roughly a billion people. The only way to change that was if people in those countries showed a desire to do the work. HOT decided to open four regional hubs – informal offices in Kenya, the Philippines, Senegal, and Uruguay. One of its earliest priorities was getting a project up and running in the Caribbean — a region the United Nations’ secretary general called “ground zero for climate change.”
The sun had climbed high and grown unwaveringly intense as the women set off on their expedition of Gros Islet. From where I stood, studying Google Maps on my phone, I realized we were entering what felt like a modern version of terra incognita. Satellite imagery captured the basic contours of the village with all its streets and silhouettes of buildings, but few businesses or roads were labeled accurately. Alleyways and roads were missing. Buildings that lay in ruins still stood according to Google Maps.
I followed my mapping group toward an empty road. A few chickens broke into a trot in front of us. I was already disoriented: Without street names or addresses, it was difficult to find our place on the map. We reached an intersection where a grand stucco church with gilded windows stood before us. A few women in the group already knew it as St. Joseph the Worker Catholic Church, which they used as a landmark to orient us on the map. Then, Weeks spotted a green street sign, likely leftover from a century of British and French colonial rule, its white lettering all but faded by the sun. It wasn’t until we were a few feet away that we could make out the faint word “Marina.” Weeks pinpointed the narrow lane on the map on her clipboard and labeled it. We took a left, down a street named Church, toward the shoreline.
Weeks was 24 when she discovered HOT’s cartography through a charity at her church. In 2021, she joined a field-mapping trip in St. Lucia’s southernmost city, Vieux Fort. With a small group, Weeks went door-to-door to record houses, street names, and businesses. Afterward, everyone went to a school computer lab to add their findings to OpenStreetMap. When Weeks pulled up the map of St. Lucia, she was stunned. She’d used Google Maps before, mostly to check traffic patterns, but had never seen her island from above. She spent hours correcting mistakes. Weeks was hooked. “It’s so addictive!” she told me as we stood at an abandoned bar near the water, surveying where we were. In the past two weeks alone, she’d made 5,584 edits, clicking away online, filling in the contours of buildings as seen from above.
We rounded another corner, passing a row of single-story wood homes, each no larger than a few hundred square feet. The stillness of the village felt deafening. We passed many abandoned houses and empty lots, which the women labeled “R” for ruins on their maps. But many places were still very alive, painted bubble-gum pink and lime green, azure blue and canary yellow. On the side of one bar, someone had painted a mural of a man gazing through binoculars with the words “Stay curious.” Near the shore, Weeks stopped in the middle of the road, furrowing her brow at her clipboard as she tried to position herself. A woman in a fitted, tan beach dress picking at a box of plantains and salted fish looked up at her. “Are you lost?” she asked.
Weeks nodded. “We are just mapping out the village. Is this a bar?” she asked, pointing at a two-story building with shuttered windows and a sign that read “Whispering Lionz.” The woman clapped her hands together excitedly. “It’s my new bar!” she replied. “We’re opening in two weeks.” Weeks noted the name on her map, while the woman helped identify the rest of the bars lining the street. She’d never used a map to orient herself in the neighborhood before.
All was still and quiet, the Caribbean Sea gently lapping the shore of Rodney Bay, the November sun burning intensely down, casting shadows onto the road in front of us. Stray dogs napped in the underbrush of leafy banana trees. It hardly seemed like the sort of place where a perilous, life-threatening storm could strike with little warning. But that was exactly the point of the mapping project: being prepared for the inevitable disasters long before they hit. The ability to identify who lived where could help apportion resources to poorer areas like Gros Islet. In times of acute crisis, the goal was for rescue teams to use the map to find people.
Like many residents of many island nations, St. Lucians live on the front lines of climate change. They are surrounded by turquoise waters that are slowly rising. Dense rainforest is prone to wildfires. Warming seas feed devastating hurricanes. Acidification threatens the marine habitat. Despite having some of the lowest greenhouse gas emissions in the world, small island nations are paying the highest price for the warming planet. “The problem is the governments of the developed countries, they still believe that there’s time or that this is not as serious as we make it out to be,” said Dr. James Fletcher, St. Lucia’s former minister of public service, sustainable development, energy, science, and technology. “I don’t think they appreciate just how much of a life-or-death threat it is for us. I think this whole question of mapping is a very important one: How do we use empirical data to determine which are the most vulnerable communities?”
In 2013, an unexpected storm struck St. Lucia on Christmas Eve — a time typically in the dry season. The “Christmas trough,” as locals now call it, shredded roads, destroyed houses, and flooded low-lying areas. Rescue workers found it nearly impossible to know where to go, or how to find people. Five people died. The disaster made the government and first responders realize that their Achilles heel lay in not being able to locate communities that were off the grid. “A lot of the communities might have an official route to reach them, and then when you go, it might be covered or doesn’t exist,” Marcia Haywood, the regional coordinator of Caritas Antilles, a nongovernmental organization focused on poverty and disaster relief, told me. “I want to see a map of St. Lucia that is a living, breathing document.”
After a few hours of exploration, my team reached an impasse: a busy highway leading into a dense forest. Weeks knew about a croissant stand at the corner — a business that didn’t appear on Google Maps but that she swore existed. We climbed a dusty hill and, sure enough, found a little wood lean-to with a red, white, and blue sign reading “Bonne Café Authentic French Bistro.” It was shuttered. None of the women knew how long it had been out of business or whether to include it on their maps. Williams decided it was time to turn around. Our team had covered about 0.05 square miles and labeled 15 businesses. “That’s a lot!” Williams told them encouragingly. The women seemed more dubious. We began making our way back to the van, where Proann Francis doled out fish sandwiches and brownies in white Styrofoam containers. Standing by the bus, I noticed a small sign reading “Centre for Adolescent Renewal and Education: the C.A.R.E. Grow Well School,” which Google had told me was in India. I logged onto OpenStreetMap on my phone to update the map. Someone had beaten me to it.
It is not until you get into the business of trying to map far-flung, disaster-prone areas that the question of what a map is becomes muddled. As HOT began expanding its mission in different parts of the world, from Zimbabwe to Dominica to Syria, the nuances of each place made creating a universal map ever more difficult. Roads, borders, buildings, and village names have a different meaning depending on whom you talked to. Once, during a project in an informal neighborhood in Dar es Salaam, a city on the Tanzanian coast that experiences regular flooding, HOT’s team was collecting data on historical inundations. They noticed that the information varied wildly, with households next door to each other reporting large variations in flood height. The next day, rather than asking people to estimate the water’s depth, they asked people to indicate where on their bodies the water had reached: their ankles, feet, knees, or hips. The findings were much more consistent. “From a traditional cartographic angle, you think that’s not good data,” Rebecca Firth, HOT’s executive director, told me. “But that’s the language people talk in. And that is actually extremely important data.”
For many people in developing countries whose villages or neighborhoods are poorly mapped, the very idea of a Western, Cartesian map can be antithetical to how they navigate the world. “When you take data out there in the world and reduce it to a line on a map, you are making an inherent argument about that place,” Robert Soden, a computer science professor at the University of Toronto and co-founder of HOT, told me. “And it tends to be people who are more powerful who make these datasets.” The OpenStreetMap model, in theory, is intended to hand that power to anyone who wants it.
Just as Wikipedia relies on the honesty of its community to keep its pages up to date, HOT is at the mercy of its 339,000 or so volunteers. It is easy to make mistakes while editing OpenStreetMap. Although the software relies on a seasoned “editor” to “approve” edits before they are published, the sheer number of revisions outweighs the expertise. An even greater challenge lies in the fact that users’ intentions are sometimes nefarious. As Sam Colchester, who leads disaster response for HOT, explained to me, “online vandalism” is a challenge. Malicious users might mislabel or even eliminate things. “It often happens in conflict areas,” Colchester told me. “Russians were deleting data in Ukraine, or renaming all the streets in western Ukraine to Russian names.” While HOT’s volunteers keep watch for such things, he said, they are often difficult to catch quickly.
The best way to ensure a map’s accuracy is to chart the place in person. But HOT’s limited resources make it impossible to launch expeditions in the 94 counties it has identified as most needing to be chronicled. Building the community needed to keep that document current is even harder. Sodden discovered that as he visited Haiti several times in 2010 and 2011, training locals on how to do just that. Eventually, the funding fell through, and it became difficult to keep the project going. “I don’t think we were successful in creating any sort of long-term map in Haiti,” he told me. “I think it’s safe to say we didn’t build a robust and self-sustaining community of mappers there.”
In the week I spent in St. Lucia, I found myself wondering what it would take to keep any map alive. How could HOT build a self-sustaining community of mappers to continuously update the ever-changing world we live in? No one who participated in the effort to document Gros Islet had returned to finish the project. Other, more pressing projects lay ahead, like Bexon, which sits between two rivers, in a basin in the middle of the island, just barely above sea level. When heavy rains come, the highway floods and the residents are cut off like a severed artery.
One day, HOT’s regional coordinator, Louise Mathurin-Serieux, picked me up in her SUV to take me to Bexon. She wanted to survey the work of a field-mapping trip taken a year ago. It had proven more challenging than Gros Islet: The small community of a few hundred people lay off a major highway that had seen frequent fatal accidents, and the rainforests teemed with venomous snakes. Houses sat in clusters and it could take 10 minutes to walk from one neighborhood to the next.
“This is the flood zone,” Mathurin-Serieux explained to me ominously, parking at the side of the road just after we crossed a yellow bridge spanning a trickle of water. When the rain is heavy, flash floods wash over the bridge, effectively cutting off everyone in Bexon. “Water!” Francis, who’d joined our trip along with Weeks, chimed in. “Water is our biggest problem!”
We stood before a handful of dilapidated houses built on stilts. Water coursing over the land during a flood last year had left its mark on many of them. One had been destroyed and lay in a pile of kindling. The government tried to get people to move to higher ground, but few wanted to budge. “A hurricane is like childbirth,” Francis explained. “You forget how bad the pain gets.”
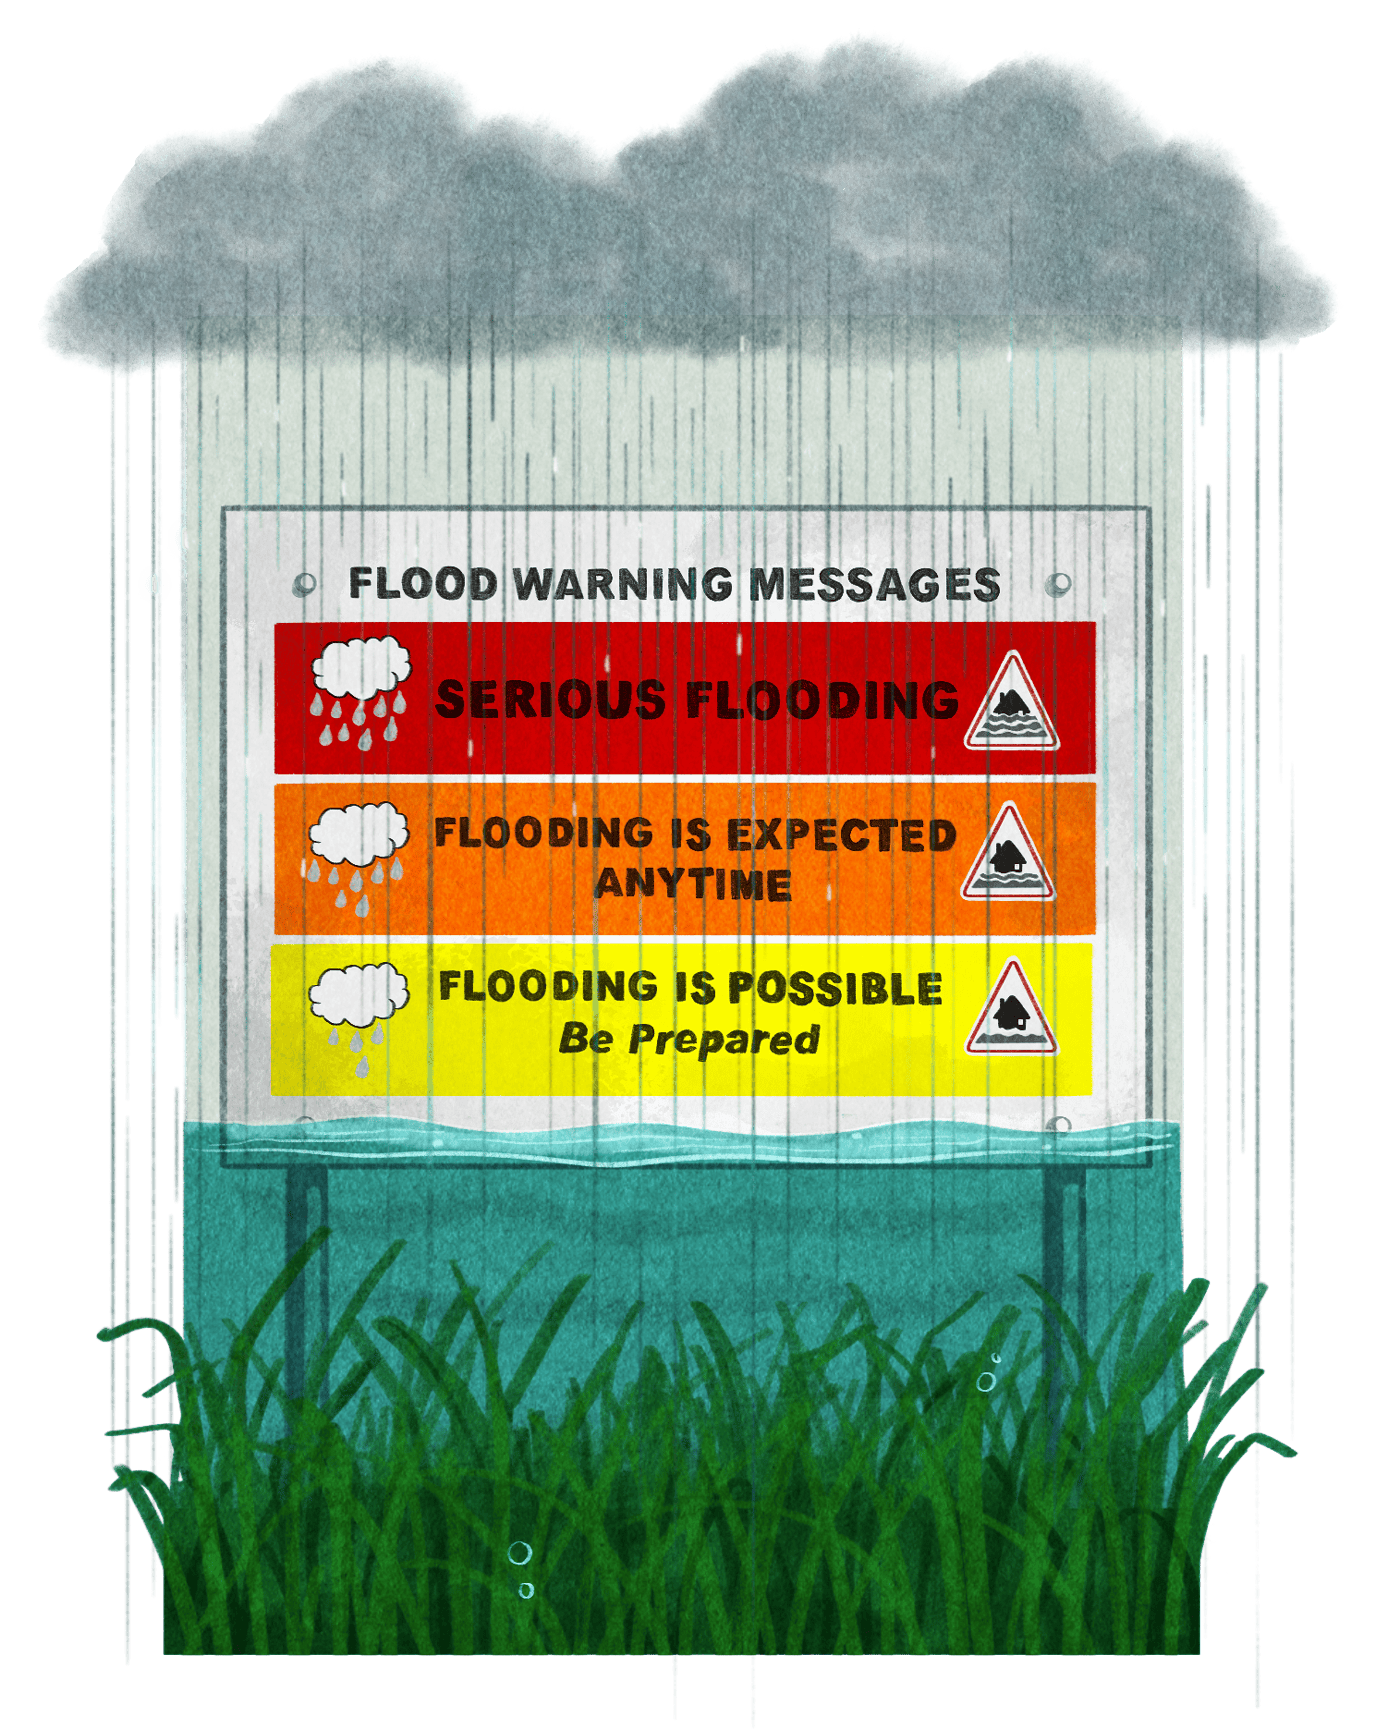
As I walked around the houses, I met an older woman named Olive, who sat watching us curiously from her front porch. She’d grown up in the same house; it was passed down to her from her grandparents. Leaving was out of the question. But she was getting increasingly worried about the changing weather. She kept a card near her front door that the government had provided that reads “Flood Warning Messages.” It was part of a system devised for locals, color-coded to rate the severity of an incoming storm. Red indicated serious flooding, orange meant inundation was expected anytime, yellow meant it is possible, be prepared. When a storm was coming, residents were instructed to run down the road to compare their cards to a sign that would indicate the severity of an incoming storm. The card was, for her, a personal map to navigate future storms.
A life-threatening storm was hard to imagine as we stood surveying Bexon, under the bright sun, with not a cloud in the sky. But that was part of the irony of HOT’s work: The success of the projects would only truly be put to the test when a major disaster hit. Since its founding 15 years ago, HOT’s small troupe of online volunteers has mapped more than 2.1 million miles of roads and 156 million buildings. Despite that progress, it is hard not to feel like their mission is a game of whack-a-mole with impending crises. Nobody had seen the Gaza invasion coming, for example, or the outbreak of an impending civil war in Haiti. More often than not, the crises were coming faster than the mappers could complete their work. Mathurin-Serieux was not deterred by this. “When it comes to mapping, we are still in our infancy,” she told me as we climbed back into her vehicle. “But if we don’t have a thriving community, then we have an outdated map in five years.”
As our car left Bexon, ascending the large hill out of town — one that was prone to landslides that would further entrench the village during heavy rain –—Weeks pointed out two new houses that had gone up since the last flood. She pulled out her phone to add the structures to OpenStreetMap. In the stillness of the calm sun, it was hard to feel the gravity of adding two small wooden lean-to residences to the map of St. Lucia. But tomorrow, those could be two lives saved.
This story was originally published by Grist with the headline Can a crowdsourced map of the world help save millions of people from climate disaster? on Jun 11, 2025.


