Charted: Air Fatalities Are Near All Time Lows
This was originally posted on our Voronoi app. Download the app for free on iOS or Android and discover incredible data-driven charts from a variety of trusted sources.
Key Takeaways
- Air travel in 2023 saw just 3 deaths per 100 million passengers, making it the second safest year ever, just behind 2017.
- Deaths per 100 million increased from 3 in 2023 to 6 in 2024.
- The most dramatic safety improvements occurred between the 1980s and 2000s, when average fatalities fell by more than 70%.
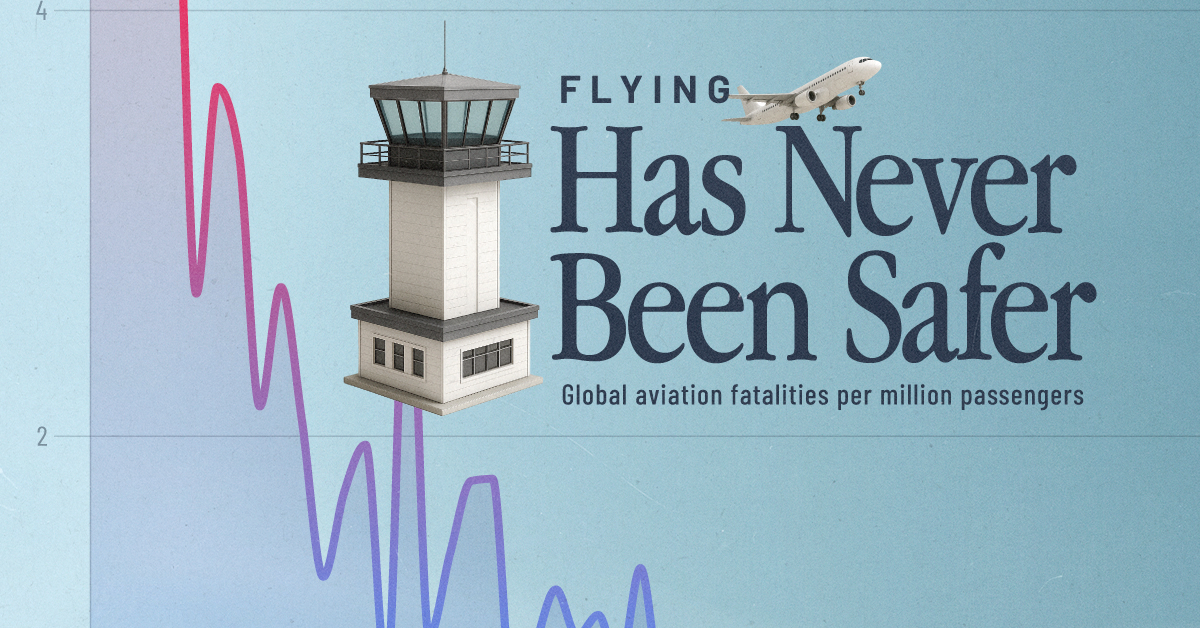
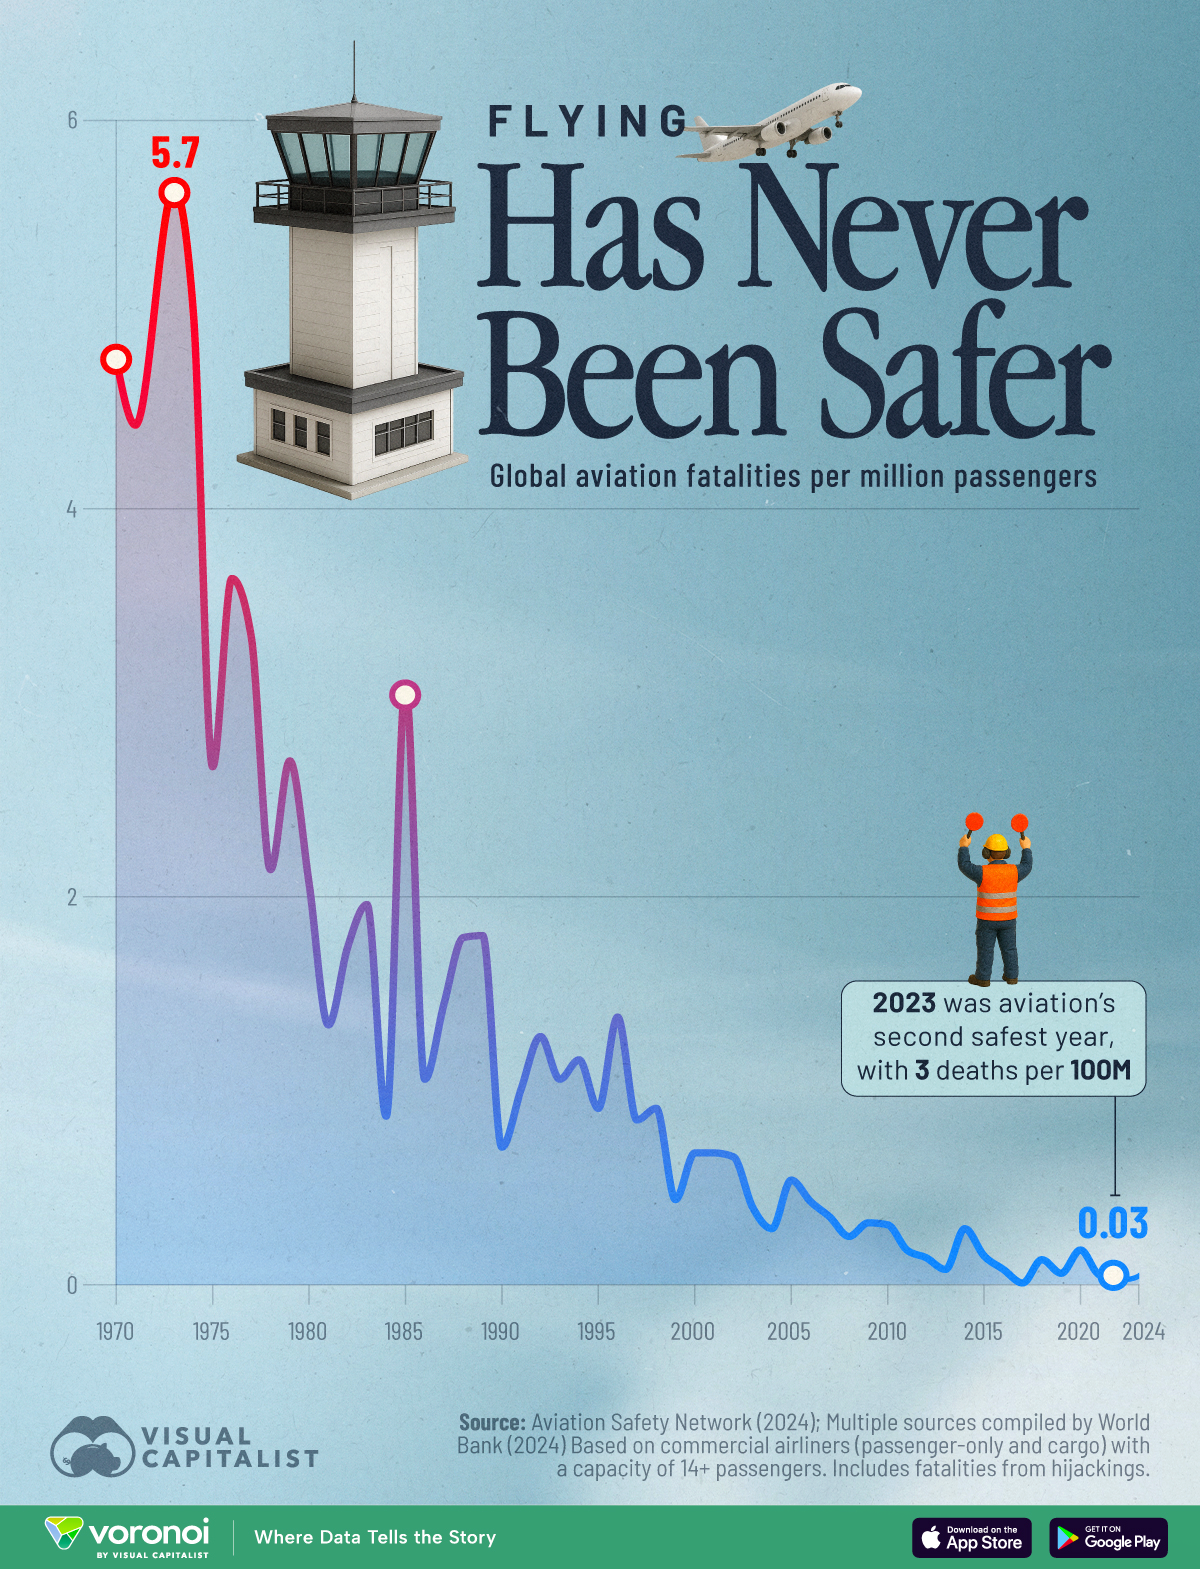
Air travel has become significantly safer over the past 50 years. This chart shows a sharp decline in fatalities per million passengers since 1970, highlighting how far aviation safety has come. In 2023, the industry recorded just 0.03 fatalities per million passengers, second only to 2017.
The data for this visualization comes from Our World in Data and IATA. It tracks aviation fatalities globally from 1970 to 2024, including both passenger and cargo flights for aircraft with more than 14 seats.
Major Improvements Since the 1980s
The 1980s saw consistent fatality rates of around 1–2 deaths per million passengers, with some years being even higher.
By contrast, the early 2000s regularly recorded rates below 0.5. This improvement reflects advances in aircraft technology, pilot training, and air traffic control.
2023: Second Safest Year on Record
With just 0.03 deaths per million passengers, 2023 ranks as the second safest year in commercial aviation history. Only 2017 had a lower rate, with nearly zero fatalities reported.
| Year | Fatalities per million |
|---|---|
| 1970 | 4.77 |
| 1971 | 4.43 |
| 1973 | 5.65 |
| 1974 | 5.01 |
| 1975 | 2.67 |
| 1976 | 3.64 |
| 1977 | 3.34 |
| 1978 | 2.14 |
| 1979 | 2.70 |
| 1980 | 2.07 |
| 1981 | 1.34 |
| 1982 | 1.74 |
| 1983 | 1.96 |
| 1984 | 0.87 |
| 1985 | 3.09 |
| 1986 | 1.06 |
| 1987 | 1.45 |
| 1988 | 1.79 |
| 1989 | 1.80 |
| 1990 | 0.71 |
| 1991 | 1.01 |
| 1992 | 1.28 |
| 1993 | 1.06 |
| 1994 | 1.16 |
| 1995 | 0.91 |
| 1996 | 1.38 |
| 1997 | 0.85 |
| 1998 | 0.91 |
| 1999 | 0.44 |
| 2000 | 0.68 |
| 2001 | 0.68 |
| 2002 | 0.66 |
| 2003 | 0.40 |
| 2004 | 0.29 |
| 2005 | 0.54 |
| 2006 | 0.43 |
| 2007 | 0.35 |
| 2008 | 0.25 |
| 2009 | 0.32 |
| 2010 | 0.31 |
| 2011 | 0.18 |
| 2012 | 0.14 |
| 2013 | 0.08 |
| 2014 | 0.29 |
| 2015 | 0.15 |
| 2016 | 0.08 |
| 2017 | 0.01 |
| 2018 | 0.13 |
| 2019 | 0.06 |
| 2020 | 0.18 |
| 2021 | 0.05 |
| 2023 | 0.03 |
| 2024 | 0.06 |
According to Flight Safety Foundation data, this achievement comes despite a strong post-pandemic rebound in global air traffic.
Why the 1970s Were More Dangerous
In 1973, air travel recorded its deadliest year in this dataset, with 5.65 deaths per million passengers. The era lacked modern navigation systems and had looser regulations. In addition, older aircraft designs and limited onboard safety features contributed to higher fatality rates.
Learn More on the Voronoi App 
If you enjoyed today’s post, check out What Do Americans Find Unacceptable on Airplanes? on Voronoi, the new app from Visual Capitalist.