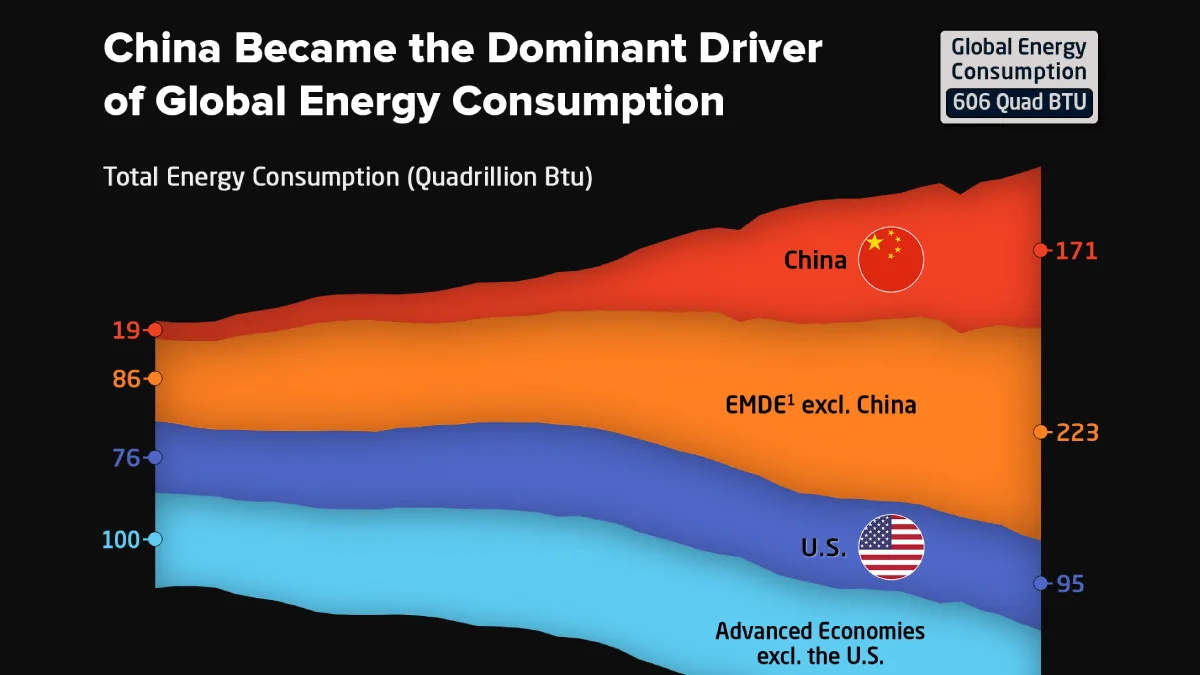
Charted: China’s Rise to Energy Superpower
See visuals like this from many other data creators on our Voronoi app. Download it for free on iOS or Android and discover incredible data-driven charts from a variety of trusted sources.
Key Takeaways
- China’s share of global energy consumption rose from 7% in 1980 to 28% in 2024, making it the world’s largest energy consumer.
- China now consumes more energy than the combined total of advanced economies outside the United States.
- Emerging and developing economies now account for 65% of global energy consumption, up from 37% in 1980.
Global energy demand has undergone a historic geographic shift over the last four decades.
In 1980, advanced economies consumed nearly two-thirds of the world’s energy. Today, emerging and developing economies account for almost two-thirds.
The chart above shows how China became the biggest driver of that transition, using data from the U.S. Energy Information Administration.
China’s Energy Share Has Quadrupled
China consumed 19 quadrillion BTUs of energy in 1980, accounting for just 7% of global demand.
By 2024, consumption had climbed to 171 quadrillion BTUs, raising China’s share to 28% and making it the world’s largest energy consumer.
| Energy Consumption (Quadrillion BTU) | |||||
|---|---|---|---|---|---|
| Year |  World World |
 Advanced Economies Advanced Economies |
 United States United States |
 EMDEs EMDEs |
 China China |
| 1980 | 281 | 176 | 76 | 105 | 19 |
| 1981 | 277 | 171 | 74 | 106 | 19 |
| 1982 | 277 | 167 | 71 | 110 | 19 |
| 1983 | 280 | 166 | 70 | 114 | 21 |
| 1984 | 294 | 173 | 74 | 121 | 22 |
| 1985 | 302 | 176 | 74 | 126 | 24 |
| 1986 | 308 | 178 | 74 | 130 | 24 |
| 1987 | 319 | 184 | 77 | 135 | 26 |
| 1988 | 331 | 190 | 81 | 141 | 27 |
| 1989 | 337 | 193 | 83 | 143 | 28 |
| 1990 | 338 | 194 | 82 | 144 | 27 |
| 1991 | 338 | 193 | 82 | 145 | 28 |
| 1992 | 337 | 196 | 84 | 141 | 29 |
| 1993 | 339 | 199 | 85 | 141 | 31 |
| 1994 | 343 | 202 | 87 | 140 | 34 |
| 1995 | 352 | 207 | 89 | 144 | 36 |
| 1996 | 361 | 214 | 91 | 147 | 38 |
| 1997 | 362 | 215 | 92 | 147 | 36 |
| 1998 | 365 | 216 | 93 | 149 | 37 |
| 1999 | 371 | 219 | 94 | 152 | 38 |
| 2000 | 384 | 223 | 97 | 160 | 41 |
| 2001 | 387 | 223 | 94 | 164 | 43 |
| 2002 | 395 | 225 | 96 | 171 | 46 |
| 2003 | 410 | 227 | 96 | 182 | 53 |
| 2004 | 431 | 232 | 98 | 199 | 64 |
| 2005 | 445 | 233 | 98 | 212 | 72 |
| 2006 | 459 | 233 | 97 | 226 | 80 |
| 2007 | 472 | 235 | 99 | 237 | 86 |
| 2008 | 478 | 231 | 97 | 247 | 89 |
| 2009 | 472 | 220 | 92 | 252 | 97 |
| 2010 | 503 | 229 | 95 | 274 | 108 |
| 2011 | 517 | 226 | 94 | 291 | 118 |
| 2012 | 526 | 222 | 92 | 304 | 125 |
| 2013 | 534 | 224 | 94 | 310 | 129 |
| 2014 | 538 | 223 | 95 | 316 | 130 |
| 2015 | 539 | 222 | 94 | 316 | 129 |
| 2016 | 544 | 223 | 94 | 321 | 130 |
| 2017 | 549 | 225 | 94 | 325 | 131 |
| 2018 | 562 | 228 | 97 | 334 | 136 |
| 2019 | 571 | 225 | 97 | 345 | 144 |
| 2020 | 547 | 208 | 89 | 339 | 146 |
| 2021 | 573 | 216 | 93 | 357 | 153 |
| 2022 | 579 | 215 | 95 | 364 | 153 |
| 2023 | 592 | 212 | 94 | 380 | 163 |
| 2024 | 606 | 212 | 95 | 394 | 171 |
The increase coincided with China’s transformation into the world’s manufacturing hub, rapid urban development, and rising household incomes, all of which required enormous amounts of energy.
Emerging Markets Now Drive Global Demand
Emerging and developing economies consumed 105 quadrillion BTUs in 1980, or 37% of the world total.
By 2024, that figure had risen to 394 quadrillion BTUs, equal to 65% of global consumption.
Even excluding China, emerging markets consumed 223 quadrillion BTUs in 2024, more than all advanced economies combined.
Much of the growth in global energy demand now comes from countries that are still industrializing and urbanizing, particularly across Asia.
Advanced Economies Have Plateaued
Advanced economies consumed 176 quadrillion BTUs in 1980 and 212 quadrillion BTUs in 2024.
While energy use continued to rise in emerging markets, demand in advanced economies grew slowly, causing their share of global consumption to steadily decline.
The Global Energy Map Has Changed
One way to understand the scale of China’s rise is to compare it with other developed economies. In 2024, China consumed 171 quadrillion BTUs of energy, exceeding the combined total of advanced economies outside the United States (118 quadrillion BTUs).
That comparison highlights how dramatically the balance of global energy demand has shifted since 1980.
Learn More on the Voronoi App 
If you enjoyed today’s post, check out Ranked: The World’s Biggest Electricity Consumers on Voronoi.