Charted: Cities with the Largest Working-Age Populations
This was originally posted on our Voronoi app. Download the app for free on iOS or Android and discover incredible data-driven charts from a variety of trusted sources.
As the world becomes increasingly urbanized, cities are transforming into economic engines driven by people of working age, who form the backbones of local economies.
From Shanghai to London, several cities have become hubs for urbanization, forming massive economies on their own.
This infographic breaks down the cities with the largest working-age populations aged 25–64 globally, based on data from Oxford Economics via CBRE Research.
The World’s Largest Urban Workforces
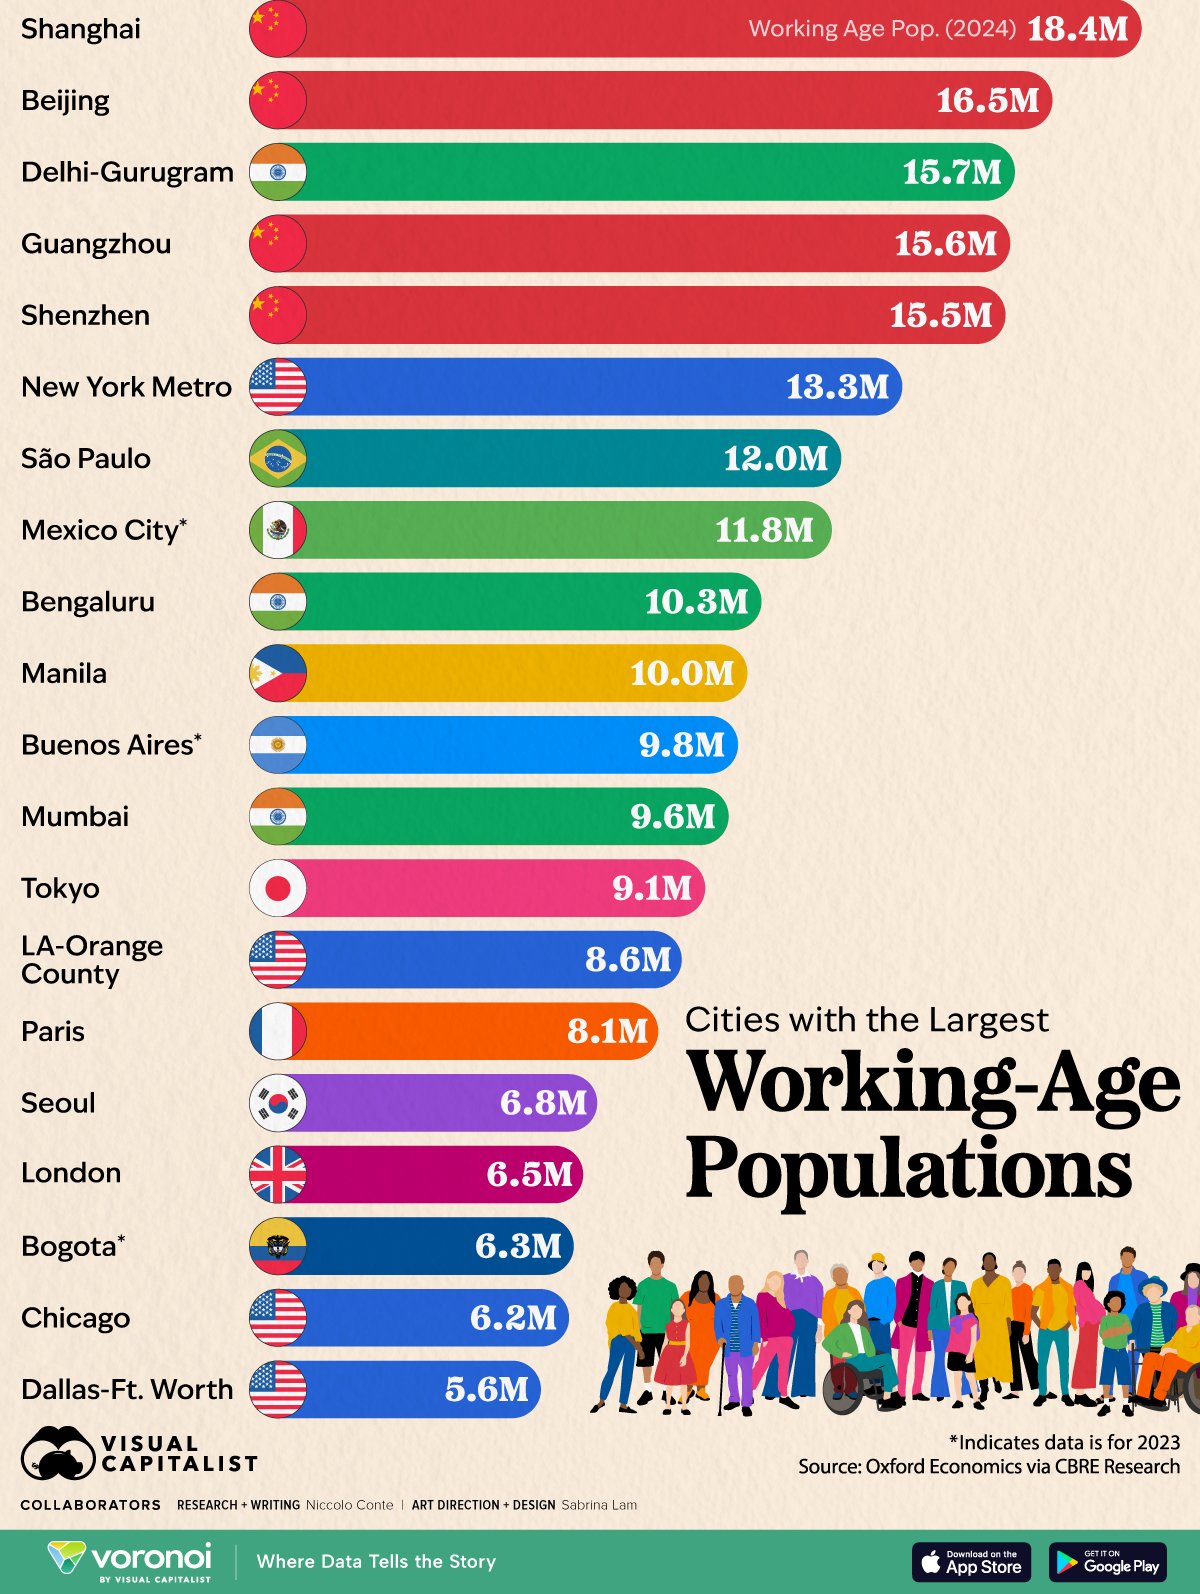
Chinese cities dominate the list of cities with the largest working-age populations, with four of the top five cities in China.
Here’s a look at the world’s top cities by working-age population:
| City/Metro Area | Country | Working Age Pop. (2024, Millions) | Share of Overall Population | Avg. Annual 5-Year Growth (2019–2024) |
|---|---|---|---|---|
| Shanghai | China  |
18.4 | 74.2% | -0.4% |
| Beijing | China |
16.5 | 75.5% | -0.3% |
| Delhi-Gurugram | India  |
15.7 | 74.7% | 1.8% |
| Guangzhou | China |
15.6 | 79.8% | 1.6% |
| Shenzhen | China |
15.5 | 83.3% | 2.1% |
| New York Metro | U.S.  |
13.3 | 64.9% | -0.7% |
| São Paulo | Brazil  |
12.0 | 52.5% | 0.8% |
| Mexico City* | Mexico  |
11.8 | 52.6% | 0.9% |
| Bengaluru | India |
10.3 | 75.7% | 2.4% |
| Manila | Philippines  |
10.0 | 70.4% | 1.4% |
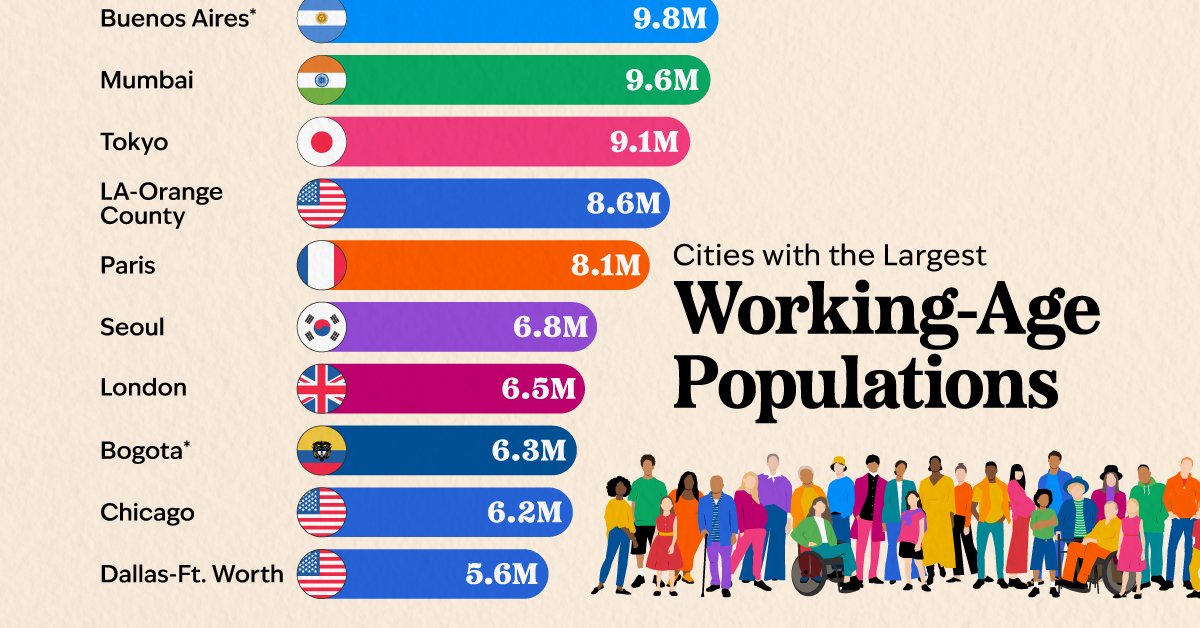
| Buenos Aires* | Argentina  |
9.8 | 62.7% | 0.8% |
| Mumbai | India |
9.6 | 75.4% | -0.2% |
| Tokyo | Japan  |
9.1 | 64.7% | 0.2% |
| L.A.-Orange County | U.S. |
8.6 | 67.4% | -0.9% |
| Paris | France  |
8.1 | 65.4% | 0.2% |
| Seoul | South Korea  |
6.8 | 72.4% | -1.2% |
| London | UK  |
6.5 | 71.0% | 0.8% |
| Bogotá* | Colombia  |
6.3 | 56.7% | 1.3% |
| Chicago | U.S. |
6.2 | 65.6% | -0.7% |
| Dallas-Ft. Worth | U.S. |
5.6 | 67.1% | 1.7% |
| Toronto | Canada  |
5.0 | 70.2% | 2.2% |
| Hong Kong SAR | Hong Kong/China  |
5.0 | 66.8% | -1.2% |
| Taipei City | Taiwan  |
4.7 | 68.2% | -1.4% |
| Madrid | Spain  |
4.7 | 67.6% | 1.1% |
| Santiago* | Chile  |
4.7 | 55.4% | 0.6% |
| San Francisco Bay Area | U.S. |
4.4 | 67.1% | -1.0% |
| Singapore | Singapore  |
4.3 | 71.2% | -0.1% |
| Washington D.C. | U.S. |
4.3 | 66.5% | 0.1% |
| Boston | U.S. |
3.3 | 66.5% | -0.3% |
| Seattle | U.S. |
2.8 | 68.2% | 0.4% |
Shanghai leads the list with 18.4 million working-age residents, followed by Beijing at 16.5 million. Shenzhen, ranking fifth on the list, is a manufacturing hub and has the highest proportion of working-age adults aged 25–64, accounting for 83.3% of its population.
Meanwhile, India, the world’s most populous country, has two cities on the list with Delhi and Mumbai both being among the cities with the biggest workforces.
New York is the largest U.S. city on the list, ranking sixth with 13.3 million working-age adults. Other American cities with significant workforces include Los Angeles, Chicago, and Dallas.
In terms of growth in working-age populations, the city of Bengaluru in India leads, averaging 2.4% annual growth over the last five years. Canada’s financial hub, Toronto, follows at 2.2%, with Shenzhen ranking third at 2.1% average growth in working-age population from 2019 to 2024.
However, urban labor markets are not growing everywhere. Cities like Seoul, Hong Kong, and San Francisco are seeing declines in their working-age populations, driven by aging, declining birth rates, and migration patterns.
Learn More on the Voronoi App 
If you enjoyed learning about this topic, check out The World’s Most Educated Countries on the Voronoi app.