

Charted: Foreign Direct Investment in Emerging Markets
Key Takeaways
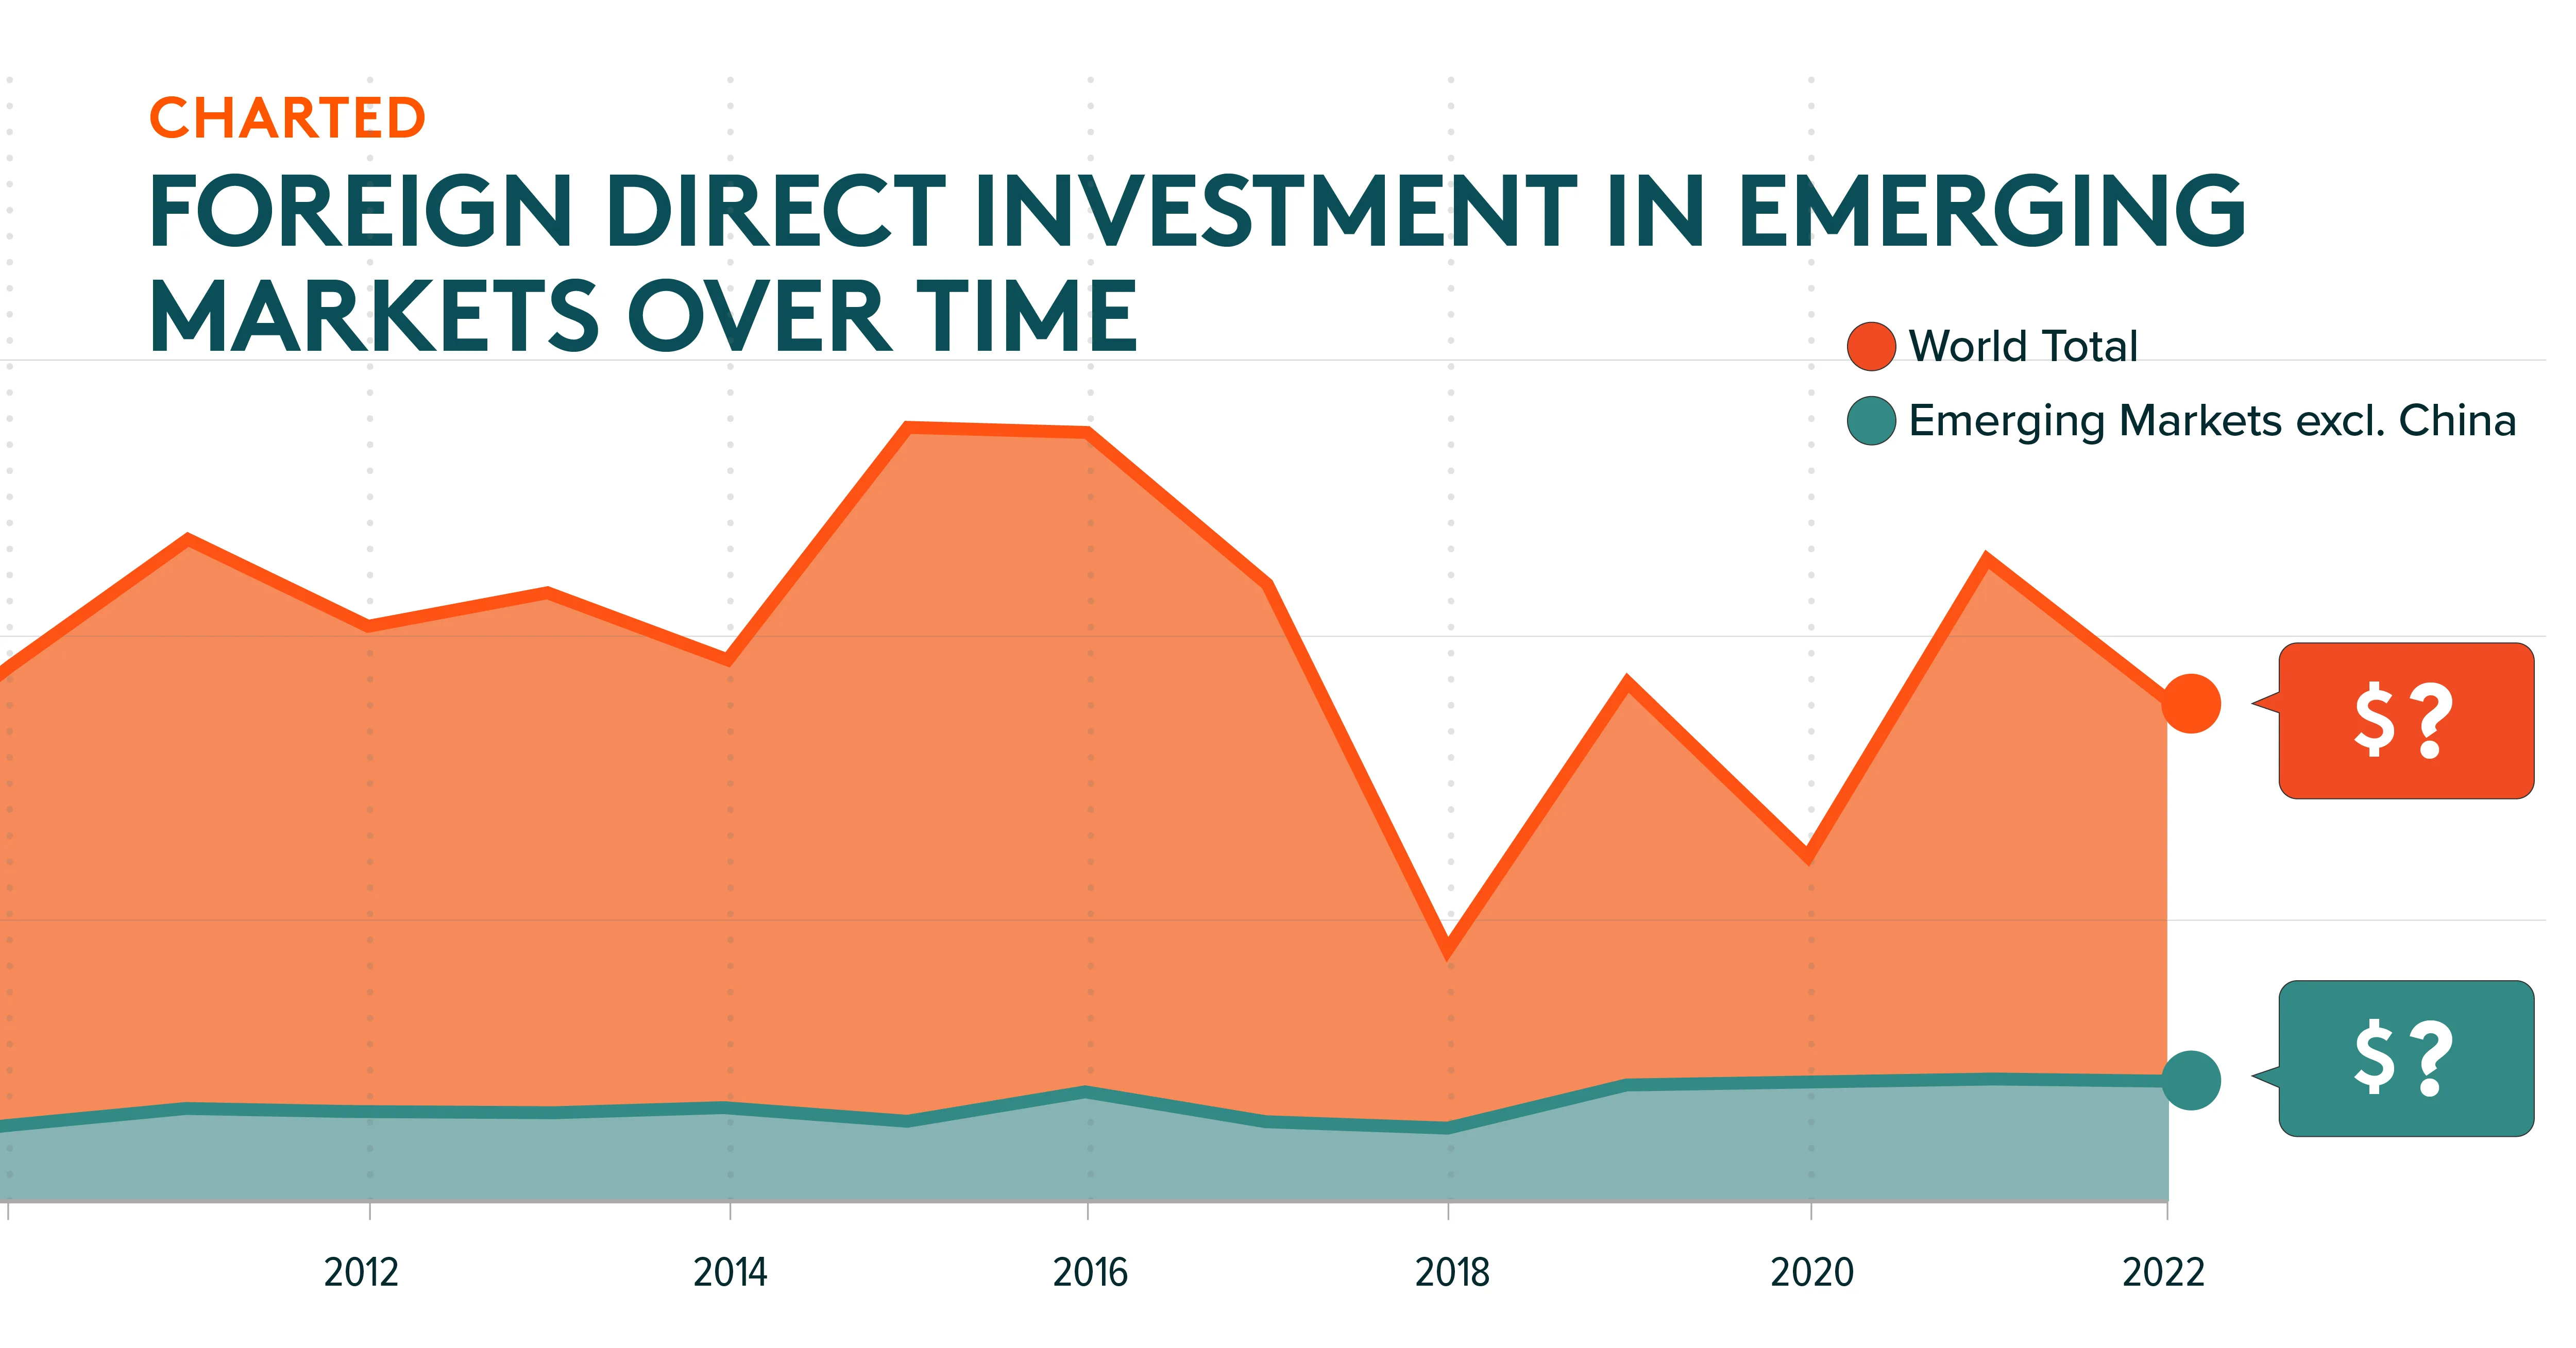
- Foreign direct investment in Emerging Markets has a compound annual growth rate (CAGR) of 8.6% between 2002 and 2022.
- World foreign investment grew a CAGR of 4.4% during the same period.
- In 2022, foreign nations invested nearly $430 billion into Emerging Markets.
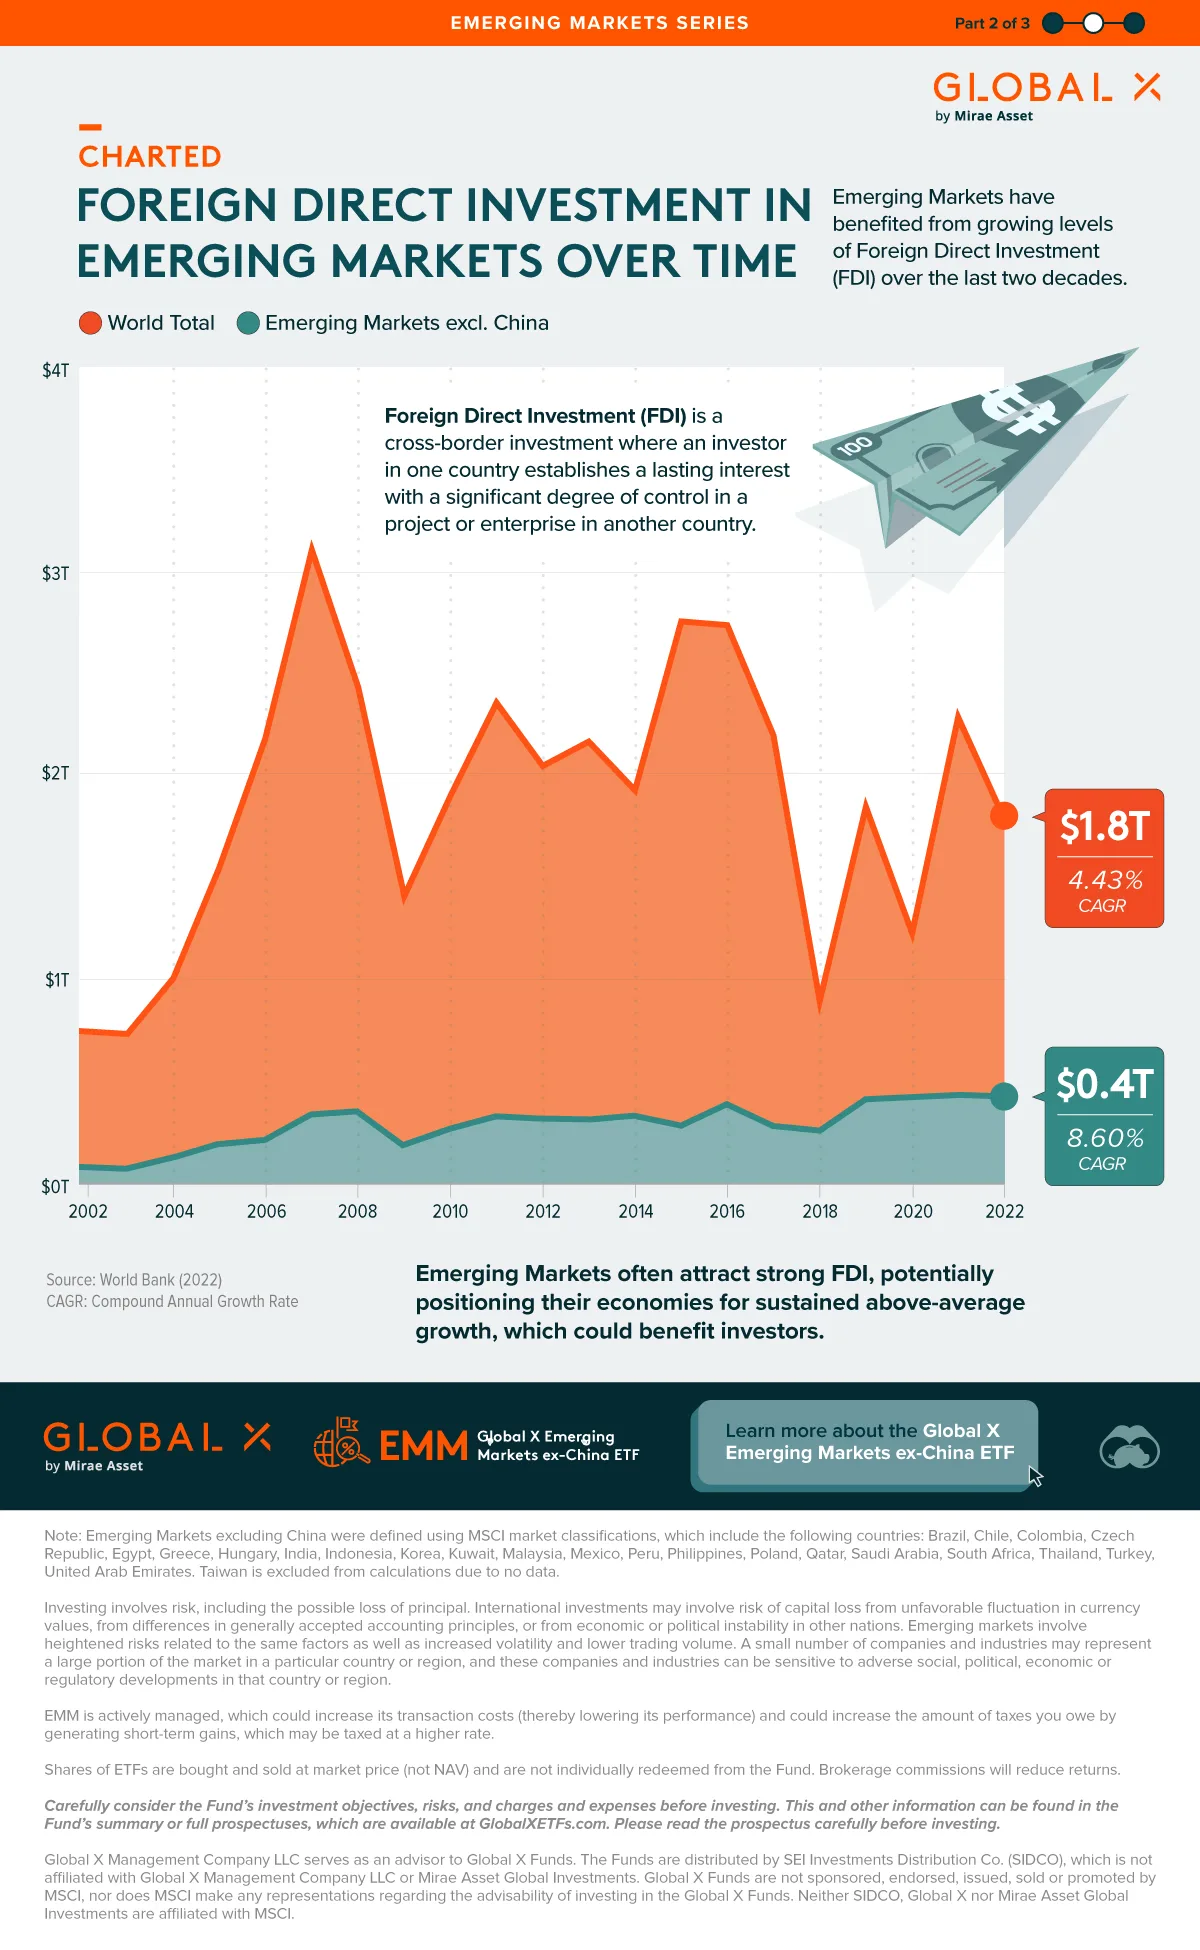
Between 2002 and 2022, foreign direct investment in Emerging Markets (EMs) grew at a CAGR of 8.6%, compared to the 4.4% CAGR for total global FDI.
Developing nations have benefited heavily, with the GDP of many booming over the same period.
In this graphic, the second in the EM Series, Visual Capitalist has partnered with Global X ETFs to explore foreign investment in developing markets over the past two decades using data from the World Bank.
Cross-Border Growth
Foreign Direct Investment (FDI) is a mechanism whereby an investor in one country establishes a lasting interest, with a decent level of control, in a project or business in another country.
Consequently, investment in these markets remains high. Below is a table that breaks down EMs (excluding China) FDI compared to the world total FDI.
| Year | EM (ex. China) Total | World Total |
|---|---|---|
| 2002 | $82.36B | $752B |
| 2003 | $73.79B | $737B |
| 2004 | $127.10B | $1,010B |
| 2005 | $195.29B | $1,550B |
| 2006 | $215.83B | $2,190B |
| 2007 | $338.80B | $3,110B |
| 2008 | $356.08B | $2,440B |
| 2009 | $189.50B | $1,410B |
| 2010 | $268.51B | $1,900B |
| 2011 | $331.20B | $2,360B |
| 2012 | $319.60B | $2,050B |
| 2013 | $315.69B | $2,170B |
| 2014 | $334.58B | $1,930B |
| 2015 | $284.87B | $2,760B |
| 2016 | $389.62B | $2,740B |
| 2017 | $282.53B | $2,200B |
| 2018 | $260.40B | $895B |
| 2019 | $414.27B | $1,850B |
| 2020 | $422.05B | $1,230B |
| 2021 | $436.46B | $2,290B |
| 2022 | $428.86B | $1,790B |
| CAGR | 8.60% | 4.43% |
EMs often attract high levels of FDI due to the growth potential of these nations, projects, or enterprises. However, it also allows investors to focus on more minor or overlooked markets.
Foreign Direct Investment in Developing Markets
Developing Markets have enjoyed a strong current of FDI in recent years, allowing the GDP of many developing nations to boom and creating opportunities in untapped markets for discerning investors.
Exploring Emerging Markets (ex. China)
The Global X Emerging Markets ex-China ETF (EMM) seeks to invest in companies, excluding those in China, that can achieve or maintain a dominant position within their respective markets.
The fund’s strategy aims to identify early winners in booming industries, where the entrepreneurship and grit held within these markets can produce long-term global competitors.

Learn more about the Global X Emerging Markets ex-China ETF (EMM).
-
 Economy44 minutes ago
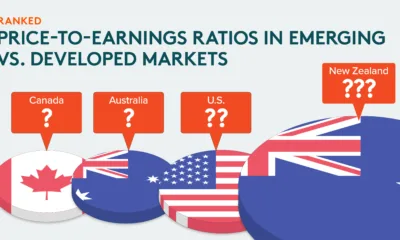
Ranked: P/E Ratios in Emerging vs. Developed Markets
Emerging markets P/E ratios trade at a 30%+ discount to developed peers. Which countries are most undervalued today?
-
 Economy4 hours ago
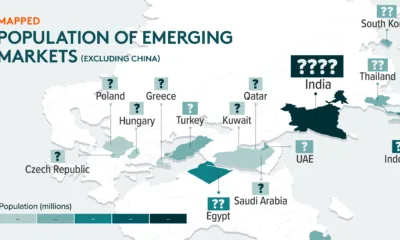
Mapped: Population of Emerging Markets
Emerging Markets are countries transitioning from developing to developed status. How significant are they in terms of global population?
-
 Markets1 month ago
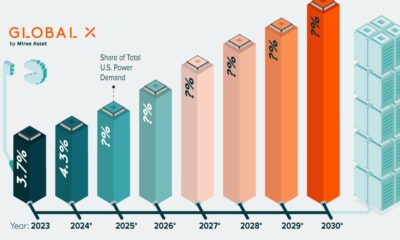
Charted: The Rising Share of U.S. Data Center Power Demand
As advanced AI adoption surges, U.S. data center demand is projected to reach nearly 12% of the nation’s power.
-
 Markets1 month ago
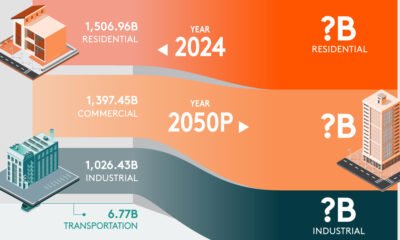
What’s Driving America’s Growing Electricity Demand?
The U.S. EIA believes that by 2050, U.S. power demand will surge by nearly 50%.
-
 Energy2 months ago
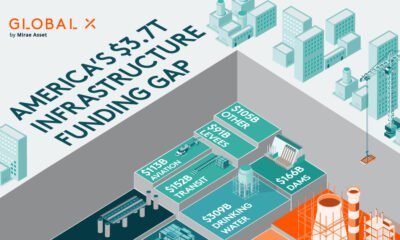
Breaking Down America’s $3.7 Trillion Infrastructure Funding Gap
Despite many government efforts to modernize U.S. infrastructure, the funding gap stood at a staggering $3.7 trillion in 2025.
-

 Politics4 months ago
Breaking Down the West’s $146 Billion 2024 Defence Technology Investment
Visual Capitalist has partnered with Global X ETFs to break down the $146 billion spent on defence technology by the U.S. and the EU.
-
 Politics4 months ago
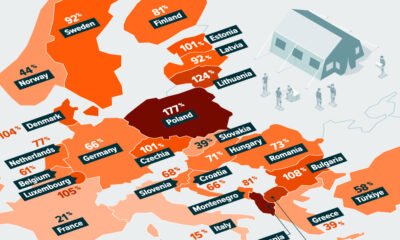
Mapped: How NATO Defence Spending Has Changed Since the Ukraine-Russia War
Visual Capitalist has partnered with Global X ETFs to explore how NATO defence spending has changed since the start of the Ukrain-Russia war.
-
 Politics4 months ago
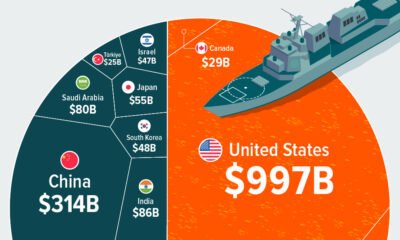
Visualized: Global Defence Spending in 2024
Visual Capitalist has partnered with Global X ETFs to explore global defence spending and find out which nation spends the most on defence.
-
 Economy5 months ago
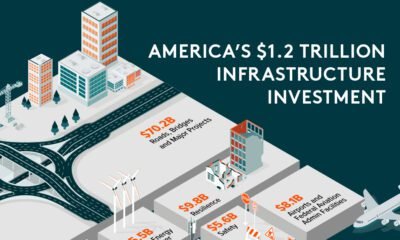
Breaking Down the 117th Congress’s $1.2T Infrastructure Investment
Graphic showing U.S. infrastructure investment highlighting that investment is primarily going to roads, bridges, and other major projects.
-
 Economy5 months ago
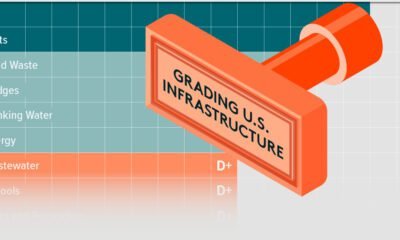
Report Card: Grading U.S. Infrastructure
This graphic shows U.S infrastructure grades and highlights the general low grade.
-
 Energy10 months ago
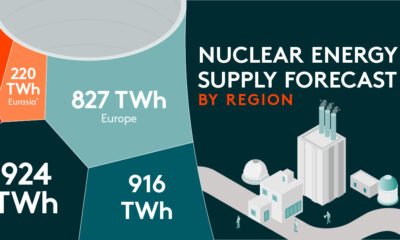
Nuclear Energy Supply Forecast by Region
Visual Capitalist and Global X partnered to explore global nuclear energy demand, and how it’s changing, in the coming years.
-
 Energy10 months ago
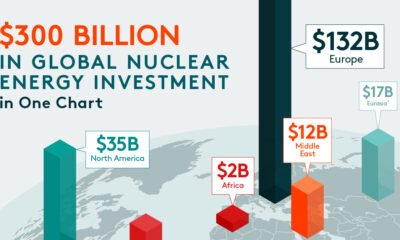
Charted: $300 Billion in Global Nuclear Energy Investment
Visual Capitalist and Global X partnered to explore nuclear energy investment and find out which regions spent the most on nuclear power.
-
 Energy10 months ago
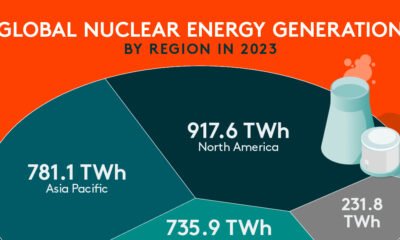
Visualized: Nuclear Energy Generation by Region
Visual Capitalist and Global X ETFs explore regional nuclear energy generation and why nuclear energy is critical to the energy transition.
-
 Technology12 months ago
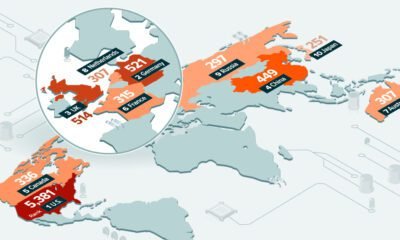
Ranked: Which Countries Have the Most Data Centers?
For this graphic, Visual Capitalist partnered with Global X ETFs to rank the nations by the number of data centers they currently operate.
-

 Technology12 months ago
Charted: How Much Data is Stored Online?
For this graphic, Visual Capitalist has partnered with Global X ETFs to explore online data generation and show how much data could be generated between 2015…
-
 Technology12 months ago
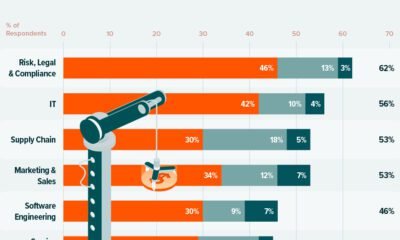
Visualized: The Impact of AI on Revenue
In this graphic, Visual Capitalist has partnered with Global X ETFs to explore the financial impact of AI adoption across various industries.
-

 Green2 years ago
Mapped: U.S. Investment in Sustainable Infrastructure (2021-2023)
This graphic shows high levels of investment in U.S. clean infrastructure between 2021 and 2023.
-

 Technology2 years ago
Visualized: What is the Artificial Intelligence of Things?
Explore the explosive growth of the Artificial Intelligence of Things (AIoT) industry and its transformative impact across sectors.
-

 Technology2 years ago
A Visual Guide to AI Adoption, by Industry
AI adoption impacts many industries, with finance leading. Discover how AI tools optimize operations, mitigate risks, and drive growth.
-
 Technology2 years ago
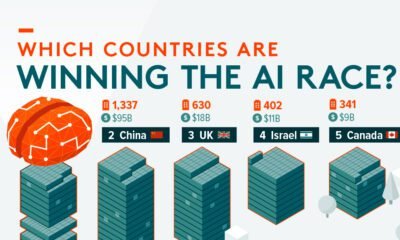
Ranked: Artificial Intelligence Startups, by Country
Find out which countries are winning the race when it comes to the number of AI startups and private investment .
-
 Technology3 years ago
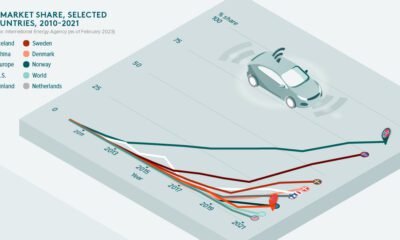
On the Road to Electric Vehicles
Electric vehicles are playing a key role in the decarbonization of road transport. But how much further do we need to go to hit net zero?
-
 Mining3 years ago
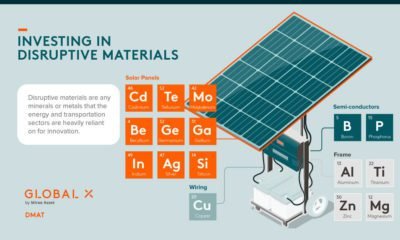
Should You Invest in Disruptive Materials?
Disruptive materials are experiencing a demand supercycle. See how these materials are helping revolutionize next generation technologies.
-
 Technology3 years ago
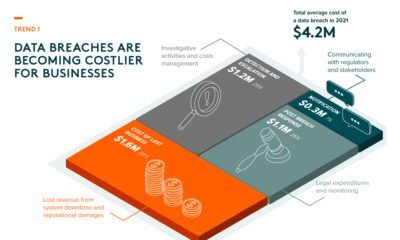
Thematic Investing: 3 Key Trends in Cybersecurity
Cyberattacks are becoming more frequent and sophisticated. Here’s what investors need to know about the future of cybersecurity.
- Source: https://www.visualcapitalist.com/sp/gx03-charted-foreign-direct-investment-in-emerging-markets/