Charted: How China Reshaped Global Oil Trade
See visuals like this from many other data creators on our Voronoi app. Download it for free on iOS or Android and discover incredible data-driven charts from a variety of trusted sources.
Key Takeaways
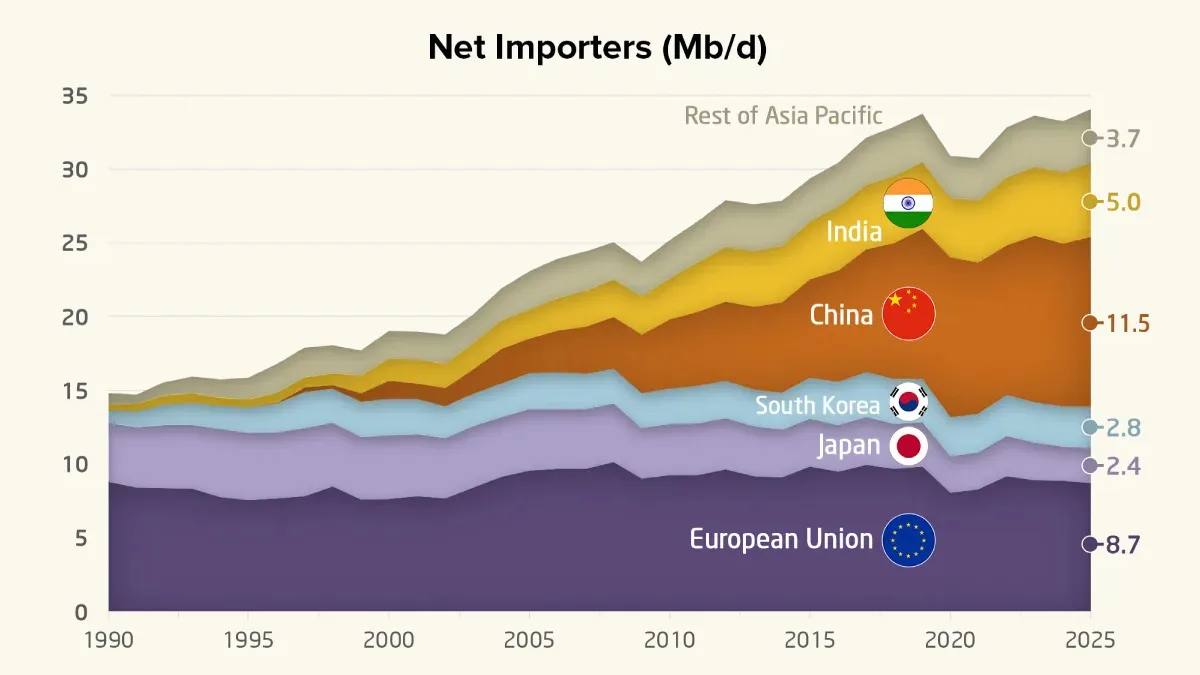
- China is now the world’s largest crude oil importer, with net imports reaching 11.5 million barrels per day in 2025.
- North America has transformed from a major importer into a net exporter following the U.S. shale boom.
- Despite shifting demand toward Asia, the Middle East remains the world’s largest crude oil exporting region.
Over the past three decades, the geography of global crude oil trade has been fundamentally reshaped.
Rapid economic growth across Asia fueled a surge in oil demand, while advances in North American production altered long-established trade flows.
This visualization tracks net crude oil imports and exports by region from 1990 to 2025, using data from OPEC, the U.S. Energy Information Administration (EIA), and the UN Comtrade Database.
Asia Has Become the Center of Global Oil Demand
China experienced the largest change of any region in the dataset.
After importing almost no crude oil in the early 1990s, China’s net imports climbed to 11.5 million barrels per day in 2025, making it the world’s largest importer.
| Year | Europe (Oil Imports, Mb/d) | China | India | S. Korea | Japan | Rest of Asia Pacific |
|---|---|---|---|---|---|---|
| 1990 | 8.8 | — | 0.4 | 0.8 | 4.0 | 0.8 |
| 1991 | 8.4 | — | 0.5 | 1.1 | 4.1 | 0.6 |
| 1992 | 8.4 | — | 0.6 | 1.4 | 4.3 | 0.9 |
| 1993 | 8.3 | — | 0.6 | 1.5 | 4.3 | 1.1 |
| 1994 | 7.8 | — | 0.6 | 1.6 | 4.6 | 1.2 |
| 1995 | 7.6 | — | 0.6 | 1.7 | 4.6 | 1.5 |
| 1996 | 7.7 | 0.0 | 0.7 | 2.0 | 4.5 | 1.9 |
| 1997 | 7.8 | 0.3 | 0.7 | 2.4 | 4.6 | 2.0 |
| 1998 | 8.5 | 0.2 | 0.8 | 2.3 | 4.3 | 1.9 |
| 1999 | 7.6 | 0.6 | 1.2 | 2.4 | 4.2 | 1.7 |
| 2000 | 7.6 | 1.2 | 1.5 | 2.5 | 4.3 | 1.8 |
| 2001 | 7.8 | 1.1 | 1.6 | 2.4 | 4.2 | 1.9 |
| 2002 | 7.7 | 1.2 | 1.7 | 2.2 | 4.1 | 2.0 |
| 2003 | 8.4 | 1.7 | 1.8 | 2.2 | 4.2 | 1.9 |
| 2004 | 9.1 | 2.4 | 1.9 | 2.3 | 4.0 | 2.2 |
| 2005 | 9.6 | 2.4 | 1.9 | 2.4 | 4.2 | 2.6 |
| 2006 | 9.7 | 2.8 | 2.2 | 2.5 | 4.1 | 2.6 |
| 2007 | 9.7 | 3.2 | 2.4 | 2.4 | 4.0 | 2.7 |
| 2008 | 10.2 | 3.5 | 2.6 | 2.3 | 4.0 | 2.5 |
| 2009 | 9.0 | 4.0 | 2.6 | 2.3 | 3.4 | 2.3 |
| 2010 | 9.3 | 4.7 | 2.8 | 2.4 | 3.5 | 2.6 |
| 2011 | 9.3 | 5.0 | 3.4 | 2.5 | 3.5 | 2.8 |
| 2012 | 9.6 | 5.4 | 3.7 | 2.6 | 3.5 | 3.2 |
| 2013 | 9.2 | 5.6 | 3.8 | 2.5 | 3.4 | 3.1 |
| 2014 | 9.1 | 6.2 | 3.8 | 2.5 | 3.2 | 3.1 |
| 2015 | 9.8 | 6.7 | 3.9 | 2.8 | 3.2 | 2.9 |
| 2016 | 9.5 | 7.6 | 4.3 | 2.9 | 3.2 | 3.0 |
| 2017 | 10 | 8.3 | 4.3 | 3.0 | 3.2 | 3.2 |
| 2018 | 9.7 | 9.2 | 4.5 | 3.0 | 3.1 | 3.3 |
| 2019 | 9.8 | 10.2 | 4.5 | 2.9 | 3.0 | 3.3 |
| 2020 | 8.1 | 10.8 | 4.0 | 2.7 | 2.5 | 2.8 |
| 2021 | 8.3 | 10.2 | 4.2 | 2.6 | 2.5 | 2.9 |
| 2022 | 9.2 | 10.1 | 4.6 | 2.8 | 2.7 | 3.4 |
| 2023 | 8.9 | 11.3 | 4.7 | 2.7 | 2.5 | 3.5 |
| 2024 | 8.9 | 11.0 | 4.8 | 2.8 | 2.3 | 3.5 |
| 2025 | 8.7 | 11.5 | 5.0 | 2.8 | 2.4 | 3.7 |
India also saw rapid growth, with imports rising from 0.8 to 5.0 million barrels per day over the same period.
Together, China and India have become the primary drivers of global crude oil demand growth.
North America’s Energy Revolution
In the early 1990s, North America was a significant net importer of crude oil. By 2019, however, the region had become a net exporter, reaching 2.5 million barrels per day by 2025.
| Year | Middle East (Oil Exports – Mb/d) | CIS | Africa | South & Central America | North America |
|---|---|---|---|---|---|
| 1990 | 11.6 | 2.1 | 3.8 | 0.2 | — |
| 1991 | 12.2 | 1.4 | 4.1 | 0.4 | — |
| 1992 | 13.0 | 1.6 | 4.0 | 0.4 | — |
| 1993 | 13.6 | 1.7 | 3.9 | 0.6 | — |
| 1994 | 13.5 | 2.0 | 4.0 | 0.8 | — |
| 1995 | 13.5 | 2.0 | 4.1 | 1.2 | — |
| 1996 | 13.4 | 2.2 | 4.3 | 1.3 | — |
| 1997 | 14.1 | 2.4 | 4.4 | 1.5 | — |
| 1998 | 15.2 | 2.6 | 4.7 | 1.6 | — |
| 1999 | 14.7 | 2.8 | 4.3 | 1.4 | — |
| 2000 | 15.6 | 3.3 | 4.6 | 1.5 | — |
| 2001 | 14.7 | 3.4 | 4.5 | 1.5 | — |
| 2002 | 13.4 | 4.0 | 4.6 | 1.1 | — |
| 2003 | 14.1 | 4.6 | 5.2 | 1.0 | — |
| 2004 | 15.9 | 5.2 | 5.9 | 1.0 | — |
| 2005 | 16.5 | 5.6 | 5.9 | 1.8 | — |
| 2006 | 16.4 | 5.8 | 5.9 | 1.3 | — |
| 2007 | 16.2 | 6.1 | 6.5 | 1.5 | — |
| 2008 | 17.0 | 6.3 | 5.8 | 1.4 | — |
| 2009 | 14.9 | 6.4 | 6.5 | 1.4 | — |
| 2010 | 15.6 | 6.5 | 6.7 | 1.8 | — |
| 2011 | 17.4 | 6.2 | 5.6 | 2.0 | — |
| 2012 | 17.7 | 6.2 | 6.4 | 2.3 | — |
| 2013 | 17.1 | 6.1 | 5.9 | 2.0 | — |
| 2014 | 16.4 | 6.0 | 5.1 | 2.7 | — |
| 2015 | 16.6 | 6.4 | 5.3 | 3.0 | — |
| 2016 | 18.9 | 6.6 | 4.9 | 3.0 | — |
| 2017 | 18.3 | 6.7 | 5.3 | 3.0 | — |
| 2018 | 18.5 | 6.9 | 5.5 | 2.6 | — |
| 2019 | 17.1 | 6.9 | 5.5 | 2.5 | 0.4 |
| 2020 | 15.8 | 6.2 | 4.4 | 2.4 | 1.6 |
| 2021 | 15.5 | 6.0 | 4.9 | 2.0 | 1.4 |
| 2022 | 17.7 | 6.3 | 4.5 | 2.2 | 1.8 |
| 2023 | 16.6 | 6.2 | 4.7 | 2.7 | 2.4 |
| 2024 | 15.7 | 6.1 | 4.6 | 3.1 | 2.2 |
| 2025 | 16.3 | 6.2 | 4.6 | 3.7 | 2.5 |
The shift was largely driven by the U.S. shale revolution, which increased domestic oil production.
Combined with growing exports from Canada, North America has become an increasingly important supplier to global markets.
The Middle East Remains the World’s Export Hub
Even as oil demand has shifted toward Asia, the Middle East remains the dominant crude oil exporting region.
Net exports stood at 16.3 million barrels per day in 2025, far exceeding those of the CIS and Africa.
Learn More on the Voronoi App 
If you enjoyed today’s post, check out Charted: The World’s Biggest Oil Producers on Voronoi.