How Investors Allocate Their Investments, by Country
See visuals like this from many other data creators on our Voronoi app. Download it for free on iOS or Android and discover incredible data-driven charts from a variety of trusted sources.
Key Takeaways
- U.S. investors allocate 78% of their equity portfolio to domestic assets, demonstrating a clear home bias.
- Investors in Norway and Canada hold a significant share of U.S. equities in their portfolios, at 48% and 45%, respectively.
“Home bias” is a common tendency for investors to invest in domestic assets.
This pattern is especially pronounced among U.S. investors—likely influenced by the country’s outsized role in global financial markets. Similarly, Japanese investors heavily concentrate their investments in local assets.
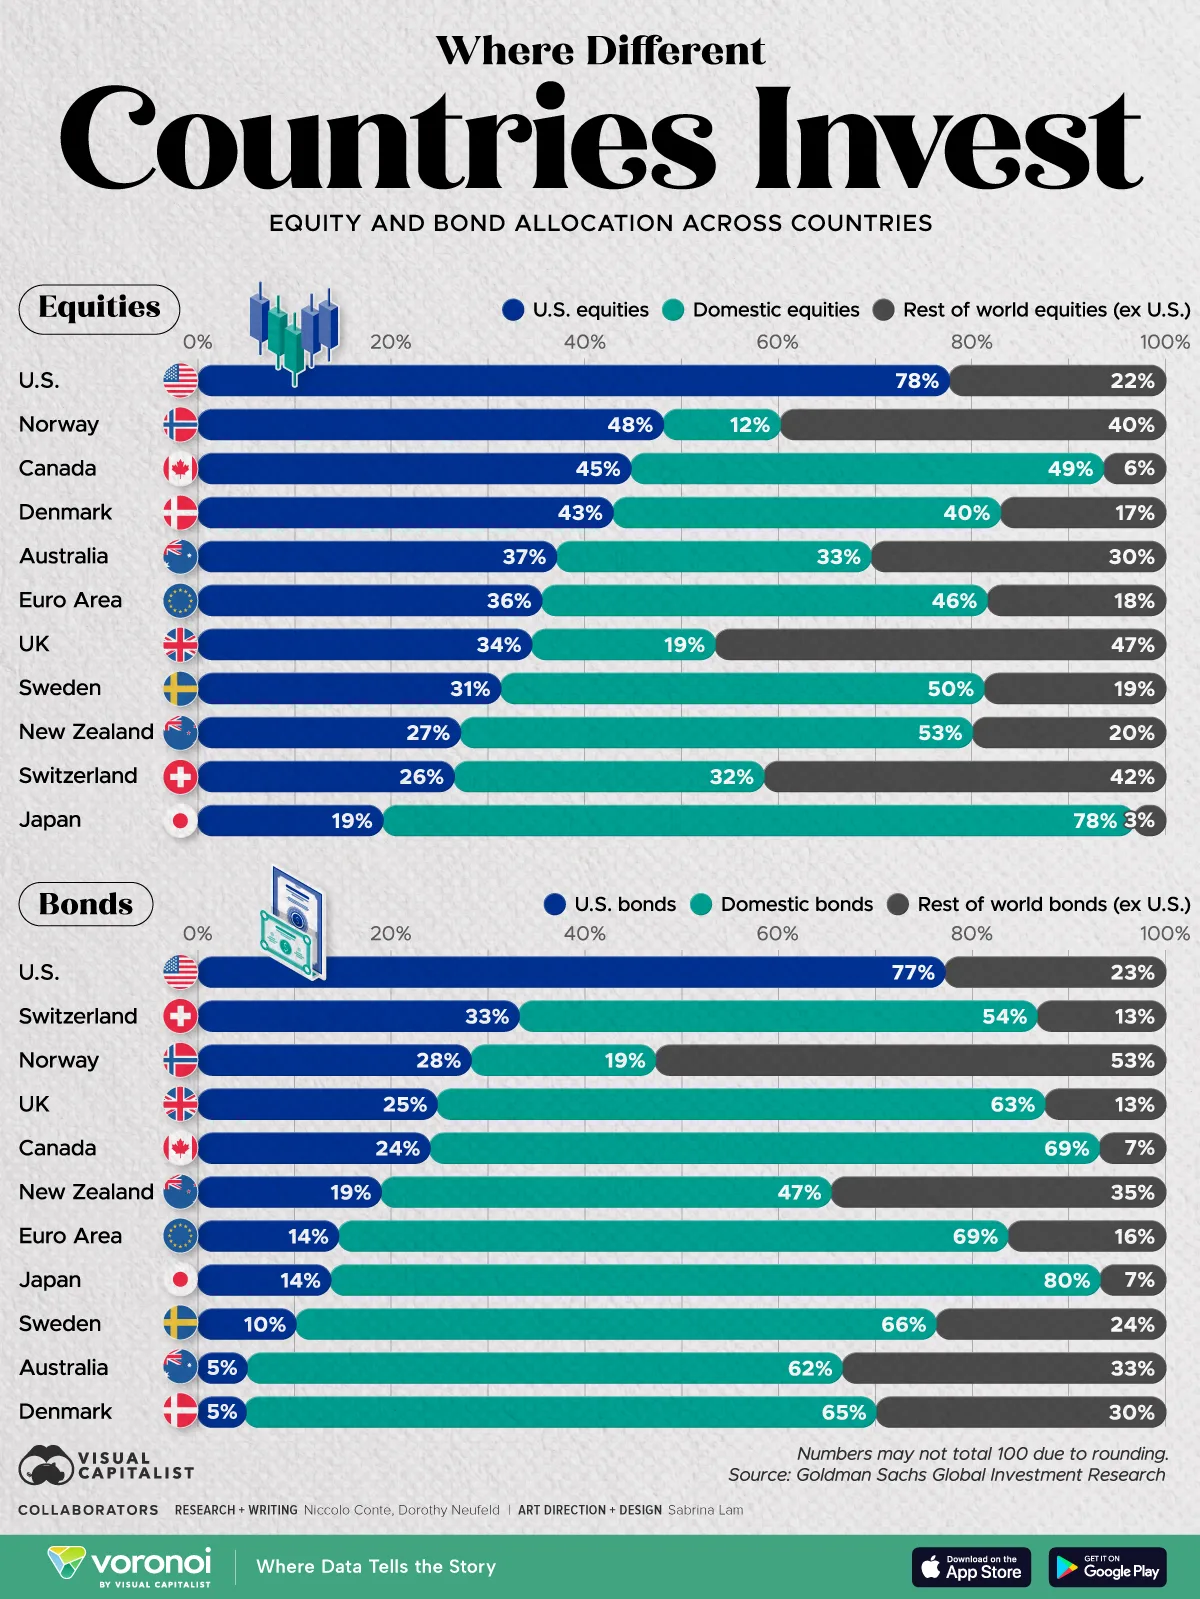
This graphic shows how different countries invest across equities and bonds, based on data from Goldman Sachs Global Investment Research.
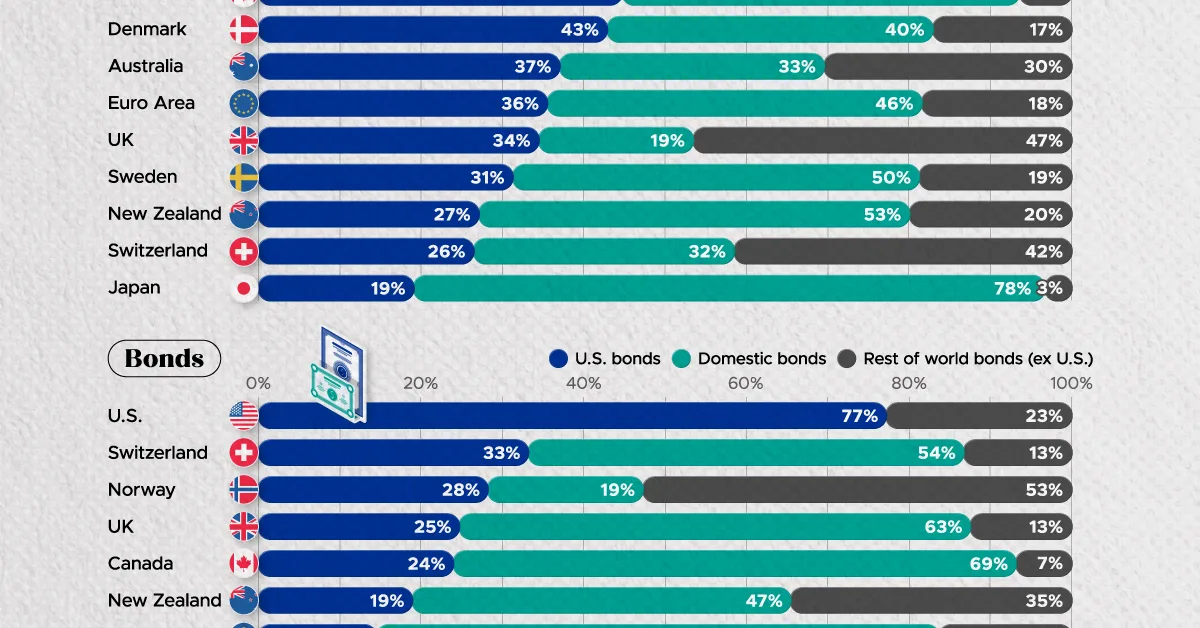
Equity Investment Allocation by Country
Below, we show the equity portfolios of countries across U.S. equities, domestic equities, and global equities:
| Country | U.S. Equities | Domestic Equities | Rest of World Equities (ex U.S.) |
|---|---|---|---|
 U.S. U.S. |
78% | N/A | 22% |
 Norway Norway |
48% | 12% | 40% |
 Canada Canada |
45% | 49% | 6% |
 Denmark Denmark |
43% | 40% | 17% |
 Australia Australia |
37% | 33% | 30% |
 Euro Area Euro Area |
36% | 46% | 18% |
 United Kingdom United Kingdom |
34% | 19% | 47% |
 Sweden Sweden |
31% | 50% | 19% |
 New Zealand New Zealand |
27% | 53% | 20% |
 Switzerland Switzerland |
26% | 32% | 42% |
 Japan Japan |
19% | 78% | 3% |
U.S. investors keep 78% of their equity holdings in domestic markets, a share comparable to Japan.
In contrast, many countries allocate a significant portion of their portfolios to U.S. equities, such as Norway (48%) and Canada (45%). Notably, Norwegian investors hold only 12% of their equity allocation in domestic stocks, despite strong average annualized returns of 13.7% since 2020.
UK investors display a similar outward tilt, holding just 19% of their equities at home. This is likely influenced by weak stock market performance and the lingering effects of Brexit. Since 2020, the FTSE 100 has delivered less than 5% in annualized returns.
Bond Investment Allocation by Country
The below table shows how countries illustrate more of a home bias when it comes to bonds:
| Country | U.S. Bonds | Domestic Bonds | Rest of World Bonds (ex U.S.) |
|---|---|---|---|
| U.S. |
77% | N/A | 23% |
| Norway |
28% | 19% | 53% |
| Canada |
24% | 69% | 7% |
| Denmark |
5% | 65% | 30% |
| Australia |
5% | 62% | 33% |
| Euro Area |
14% | 69% | 16% |
| United Kingdom |
25% | 63% | 13% |
| Sweden |
10% | 66% | 24% |
| New Zealand |
19% | 47% | 35% |
| Switzerland |
33% | 54% | 13% |
| Japan |
14% | 80% | 7% |
As we can see, Japanese investors illustrate the strongest home bias, with 80% of fixed income investments held domestically.
Meanwhile, European investors also mirror this trend, with 69% allocated into domestic bonds. Factors such as familiarity and potential tax advantages may influence this trend.
For investors diversifying abroad, Switzerland has the highest allocation in U.S. bonds, at 33%. This is likely influenced by the strength of its currency, and comparatively higher U.S. bond yields given Switzerland’s current 0% interest rate.
Learn More on the Voronoi App 
To learn more about this topic, check out this graphic on the $127 trillion dollar global stock market.