Life Expectancy vs. Healthcare Spending (1970-2023)
See visuals like this from many other data creators on our Voronoi app. Download it for free on iOS or Android and discover incredible data-driven charts from a variety of trusted sources.
Key Takeaways
- Life expectancy is one proxy for comparing health outcomes across countries.
- The U.S. spends more than twice as much per capita on healthcare as other high-income countries, yet has a lower life expectancy than the OECD average.
- Several factors—many outside the healthcare system itself—help explain this gap.
As Warren Buffett popularized: “Price is what you pay, value is what you get”.
Just because someone pays the most, doesn’t mean that they extract the biggest payoff from a product or service.
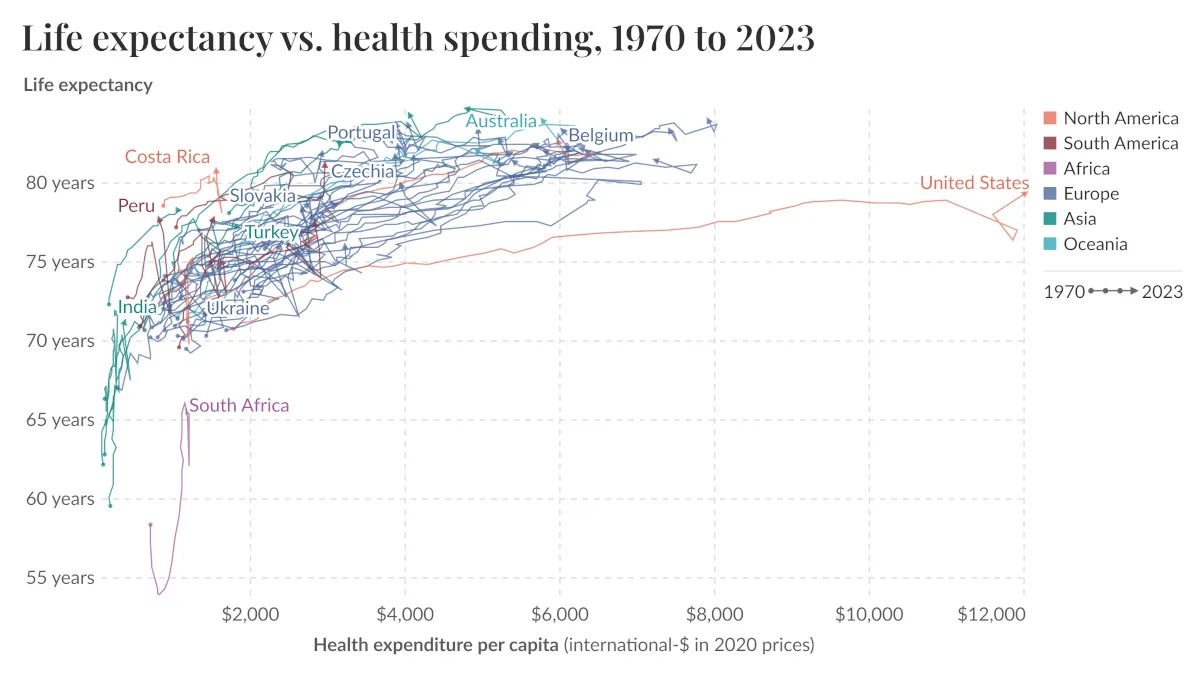
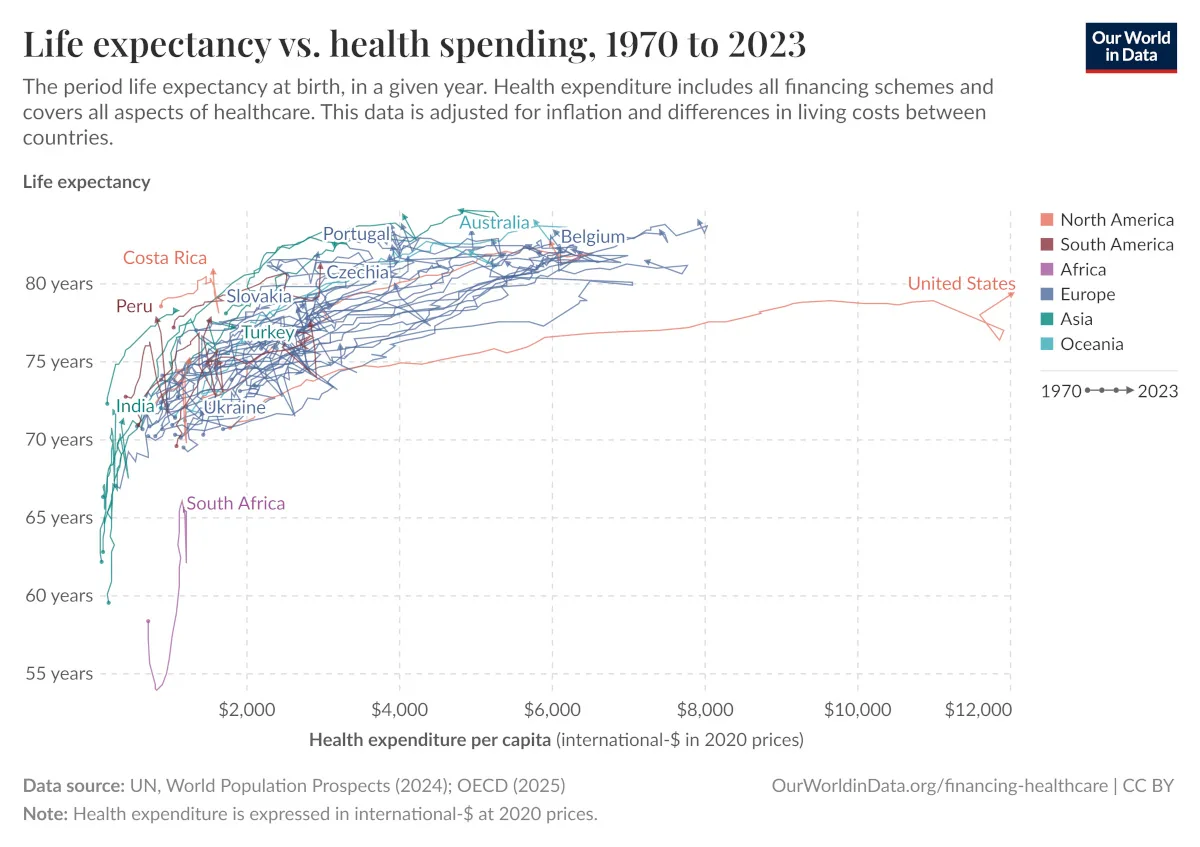
Today’s visual from Our World in Data that compares life expectancy with healthcare spending per capita hints at exactly this paradox.
Interactive Version
First of all, here’s an interactive version of the chart above to play with:
You can add and subtract countries by clicking on “Select Countries and Regions”. You can also edit the years shown.
The Data on Life Expectancy vs. Healthcare Spending
Below is the data for 51 countries for the year 2023:
| Rank | Country | Life expectancy (2023) | Health expenditure per capita (2023) |
|---|---|---|---|
| 1 |  Japan Japan |
84.71 | $4,806 |
| 2 |  South Korea South Korea |
84.33 | $4,055 |
| 3 |  Switzerland Switzerland |
83.95 | $7,930 |
| 4 |  Australia Australia |
83.92 | $5,778 |
| 5 |  Italy Italy |
83.72 | $4,046 |
| 6 |  Spain Spain |
83.67 | $3,901 |
| 7 |  France France |
83.33 | $6,036 |
| 8 |  Norway Norway |
83.31 | $7,424 |
| 9 |  Malta Malta |
83.30 | $4,941 |
| 10 |  Sweden Sweden |
83.26 | $6,204 |
| 11 |  Iceland Iceland |
82.69 | $5,228 |
| 12 |  Canada Canada |
82.63 | $5,981 |
| 13 |  Ireland Ireland |
82.41 | $5,689 |
| 14 |  Israel Israel |
82.41 | $3,154 |
| 15 |  Portugal Portugal |
82.36 | $3,906 |
| 16 |  Luxembourg Luxembourg |
82.23 | $6,078 |
| 17 |  Netherlands Netherlands |
82.16 | $6,273 |
| 18 |  Belgium Belgium |
82.12 | $6,123 |
| 19 |  New Zealand New Zealand |
82.09 | $4,938 |
| 20 |  Austria Austria |
81.96 | $6,361 |
| 21 |  Denmark Denmark |
81.93 | $5,823 |
| 22 |  Finland Finland |
81.91 | $5,375 |
| 23 |  Greece Greece |
81.86 | $2,943 |
| 24 |  Cyprus Cyprus |
81.65 | $3,869 |
| 25 |  Slovenia Slovenia |
81.60 | $4,118 |
| 26 |  Germany Germany |
81.38 | $7,248 |
| 27 |  United Kingdom United Kingdom |
81.30 | $5,413 |
| 28 |  Chile Chile |
81.17 | $2,964 |
| 29 |  Costa Rica Costa Rica |
80.80 | $1,565 |
| 30 |  Czechia Czechia |
79.83 | $3,943 |
| 31 |  United States United States |
79.30 | $12,023 |
| 32 |  Estonia Estonia |
79.15 | $2,921 |
| 33 |  Poland Poland |
78.63 | $3,125 |
| 34 |  Croatia Croatia |
78.58 | $2,751 |
| 35 |  Slovakia Slovakia |
78.34 | $2,672 |
| 36 |  China China |
78.20 | $1,086 |
| 37 |  Peru Peru |
77.74 | $817 |
| 38 |  Colombia Colombia |
77.73 | $1,537 |
| 39 |  Argentina Argentina |
77.40 | $2,850 |
| 40 |  Turkey Turkey |
77.16 | $1,846 |
| 41 |  Hungary Hungary |
77.02 | $2,613 |
| 42 |  Latvia Latvia |
76.19 | $2,494 |
| 43 |  Lithuania Lithuania |
76.03 | $3,224 |
| 44 |  Romania Romania |
75.94 | $2,373 |
| 45 |  Bulgaria Bulgaria |
75.64 | $2,612 |
| 46 |  Mexico Mexico |
75.07 | $1,244 |
| 47 |  Brazil Brazil |
74.87 | $1,661 |
| 48 |  India India |
71.70 | $290 |
| 49 |  Ukraine Ukraine |
71.63 | $1,429 |
| 50 |  Indonesia Indonesia |
71.15 | $376 |
| 51 |  South Africa South Africa |
65.45 | $1,218 |
| — | Average | 79.74 | $3,986 |
The clear takeaway is that while most high and upper-middle income countries cluster around the same trajectory, the United States is a clear outlier.
On average, the countries on the above list have a life expectancy of 79.74 years for a cost of $3,986 per person, while the U.S. has a life expectancy of 79.3 and spend of $12,023 per person.
Peer countries (Canada, UK, Germany, Japan, France, Italy) spend about half of what the U.S. does on healthcare per capita on average, but all have better life expectancy outcomes.
Why is the U.S. an Outlier?
While the U.S. excels in advanced and specialized medical care, life expectancy outcomes are held back by lifestyle and social factors rather than clinical capability.
Higher rates of obesity, chronic disease, opioid overdoses, gun violence, and traffic fatalities all weigh on average lifespan.
At the same time, healthcare access is uneven, with large gaps by income, race, and geography. As a result, additional spending often goes toward higher prices and end-of-life care, producing diminishing returns in overall life expectancy.
Learn More on the Voronoi App 
View the highest and lowest life expectancy rates around the world in this map.