Charted: Long-Term Unemployment in the U.S. (2005–2025)
See visuals like this from many other data creators on our Voronoi app. Download it for free on iOS or Android and discover incredible data-driven charts from a variety of trusted sources.
Key Takeaways
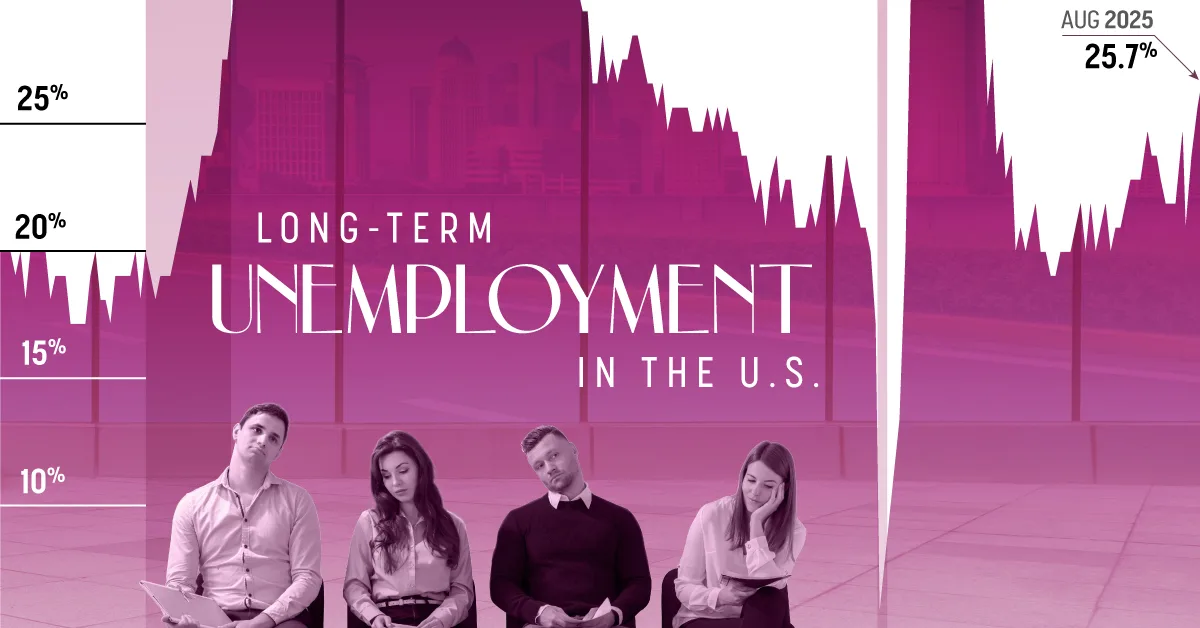
- The long-term unemployment rate hit 25.7% of all unemployed people in August 2025, rising 4.2 percentage points (about 385,000 people) in one year.
- This is the highest it’s been since February, 2025.
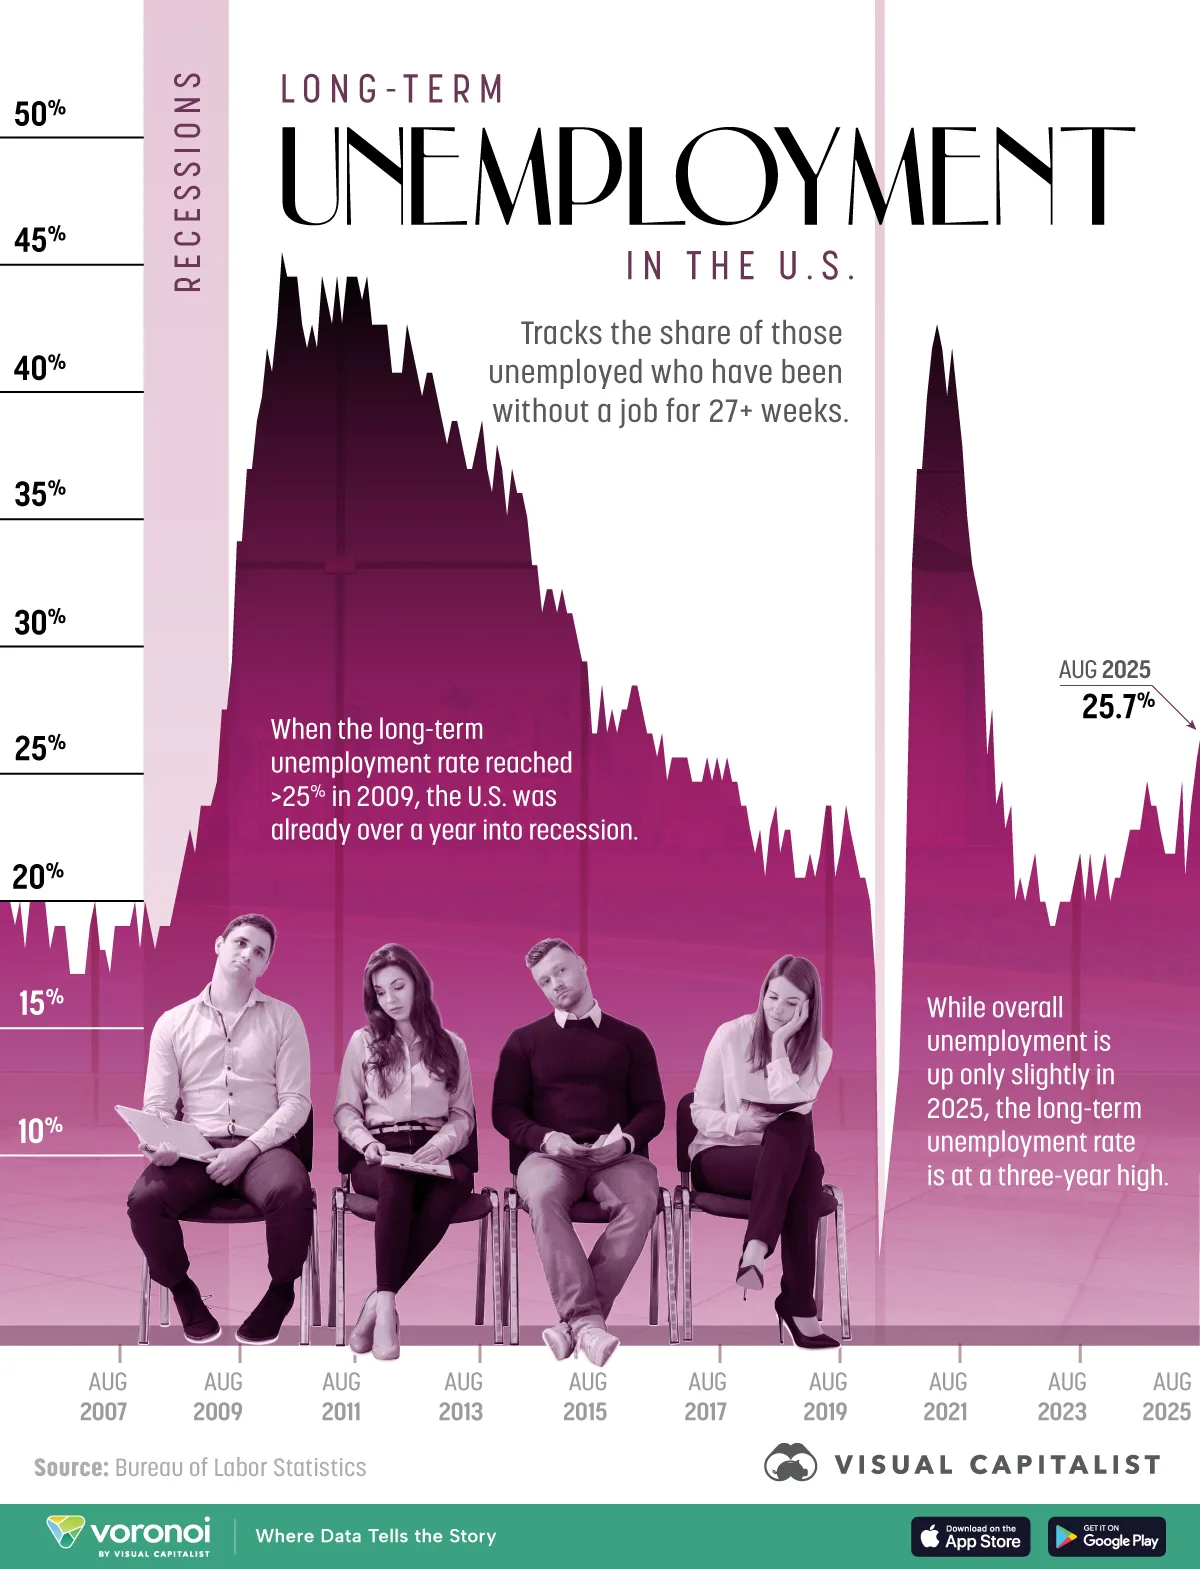
- When the metric first breached 25% in 2009, the U.S. was already more than a year into recession, highlighting the measure’s value as an early warning signal.
U.S. workers who have been jobless for at least 27 weeks now make up more than a quarter of all unemployed people.
The visualization and article track this share—and the headline unemployment rate—every month since 2005, capturing two recessions.
The data for this visualization comes from the Bureau of Labor Statistics and the Federal Reserve’s FRED database.
Unemployment’s Slow Climb Out of Recessions
During the Great Recession, the share of long-term unemployed more than doubled in 18 months, topping out at 45.5% in April 2010 even as the headline unemployment rate had already begun to retreat.
| Month | Share of long-term unemployed (27 weeks or longer) |
Overall unemployment rate |
|---|---|---|
| Aug 2005 | 18.9% | 4.9% |
| Sep 2005 | 18.9% | 5.0% |
| Oct 2005 | 18.9% | 5.0% |
| Nov 2005 | 18.0% | 5.0% |
| Dec 2005 | 18.7% | 4.9% |
| Jan 2006 | 16.7% | 4.7% |
| Feb 2006 | 18.7% | 4.8% |
| Mar 2006 | 18.6% | 4.7% |
| Apr 2006 | 18.6% | 4.7% |
| May 2006 | 18.9% | 4.6% |
| Jun 2006 | 16.6% | 4.6% |
| Jul 2006 | 18.3% | 4.7% |
| Aug 2006 | 18.3% | 4.7% |
| Sep 2006 | 18.1% | 4.5% |
| Oct 2006 | 15.9% | 4.4% |
| Nov 2006 | 16.4% | 4.5% |
| Dec 2006 | 16.2% | 4.4% |
| Jan 2007 | 16.3% | 4.6% |
| Feb 2007 | 18.0% | 4.5% |
| Mar 2007 | 18.6% | 4.4% |
| Apr 2007 | 17.4% | 4.5% |
| May 2007 | 16.5% | 4.4% |
| Jun 2007 | 16.4% | 4.6% |
| Jul 2007 | 18.3% | 4.7% |
| Aug 2007 | 17.5% | 4.6% |
| Sep 2007 | 17.5% | 4.7% |
| Oct 2007 | 17.7% | 4.7% |
| Nov 2007 | 18.9% | 4.7% |
| Dec 2007 | 17.4% | 5.0% |
| Jan 2008 | 18.5% | 5.0% |
| Feb 2008 | 17.8% | 4.9% |
| Mar 2008 | 16.9% | 5.1% |
| Apr 2008 | 17.7% | 5.0% |
| May 2008 | 18.3% | 5.4% |
| Jun 2008 | 18.2% | 5.6% |
| Jul 2008 | 18.9% | 5.8% |
| Aug 2008 | 19.8% | 6.1% |
| Sep 2008 | 21.3% | 6.1% |
| Oct 2008 | 22.3% | 6.5% |
| Nov 2008 | 21.1% | 6.8% |
| Dec 2008 | 23.1% | 7.3% |
| Jan 2009 | 22.6% | 7.8% |
| Feb 2009 | 23.4% | 8.3% |
| Mar 2009 | 24.2% | 8.7% |
| Apr 2009 | 27.1% | 9.0% |
| May 2009 | 27.0% | 9.4% |
| Jun 2009 | 29.0% | 9.5% |
| Jul 2009 | 34.0% | 9.5% |
| Aug 2009 | 34.3% | 9.6% |
| Sep 2009 | 36.6% | 9.8% |
| Oct 2009 | 36.6% | 10.0% |
| Nov 2009 | 39.3% | 9.9% |
| Dec 2009 | 40.4% | 9.9% |
| Jan 2010 | 41.6% | 9.8% |
| Feb 2010 | 40.5% | 9.8% |
| Mar 2010 | 43.2% | 9.9% |
| Apr 2010 | 45.5% | 9.9% |
| May 2010 | 44.9% | 9.6% |
| Jun 2010 | 44.9% | 9.4% |
| Jul 2010 | 44.9% | 9.4% |
| Aug 2010 | 42.8% | 9.5% |
| Sep 2010 | 42.3% | 9.5% |
| Oct 2010 | 42.6% | 9.4% |
| Nov 2010 | 42.4% | 9.8% |
| Dec 2010 | 44.6% | 9.3% |
| Jan 2011 | 43.8% | 9.1% |
| Feb 2011 | 42.8% | 9.0% |
| Mar 2011 | 44.6% | 9.0% |
| Apr 2011 | 43.0% | 9.1% |
| May 2011 | 44.7% | 9.0% |
| Jun 2011 | 44.6% | 9.1% |
| Jul 2011 | 45.1% | 9.0% |
| Aug 2011 | 43.6% | 9.0% |
| Sep 2011 | 45.2% | 9.0% |
| Oct 2011 | 42.6% | 8.8% |
| Nov 2011 | 43.2% | 8.6% |
| Dec 2011 | 42.7% | 8.5% |
| Jan 2012 | 42.7% | 8.3% |
| Feb 2012 | 41.1% | 8.3% |
| Mar 2012 | 41.3% | 8.2% |
| Apr 2012 | 40.8% | 8.2% |
| May 2012 | 42.7% | 8.2% |
| Jun 2012 | 42.3% | 8.2% |
| Jul 2012 | 41.2% | 8.2% |
| Aug 2012 | 40.4% | 8.1% |
| Sep 2012 | 40.5% | 7.8% |
| Oct 2012 | 40.6% | 7.8% |
| Nov 2012 | 40.2% | 7.7% |
| Dec 2012 | 38.8% | 7.9% |
| Jan 2013 | 37.5% | 8.0% |
| Feb 2013 | 39.2% | 7.7% |
| Mar 2013 | 39.1% | 7.5% |
| Apr 2013 | 37.8% | 7.6% |
| May 2013 | 37.3% | 7.5% |
| Jun 2013 | 37.0% | 7.5% |
| Jul 2013 | 37.6% | 7.3% |
| Aug 2013 | 38.6% | 7.2% |
| Sep 2013 | 36.8% | 7.2% |
| Oct 2013 | 35.9% | 7.2% |
| Nov 2013 | 37.7% | 6.9% |
| Dec 2013 | 37.1% | 6.7% |
| Jan 2014 | 35.3% | 6.6% |
| Feb 2014 | 36.5% | 6.7% |
| Mar 2014 | 35.6% | 6.7% |
| Apr 2014 | 35.6% | 6.2% |
| May 2014 | 34.5% | 6.3% |
| Jun 2014 | 32.9% | 6.1% |
| Jul 2014 | 32.6% | 6.2% |
| Aug 2014 | 31.2% | 6.1% |
| Sep 2014 | 31.7% | 5.9% |
| Oct 2014 | 31.8% | 5.7% |
| Nov 2014 | 31.1% | 5.8% |
| Dec 2014 | 32.0% | 5.6% |
| Jan 2015 | 31.3% | 5.7% |
| Feb 2015 | 30.8% | 5.5% |
| Mar 2015 | 29.8% | 5.4% |
| Apr 2015 | 29.4% | 5.4% |
| May 2015 | 28.6% | 5.6% |
| Jun 2015 | 26.2% | 5.3% |
| Jul 2015 | 26.0% | 5.2% |
| Aug 2015 | 27.6% | 5.1% |
| Sep 2015 | 26.3% | 5.0% |
| Oct 2015 | 26.7% | 5.0% |
| Nov 2015 | 25.8% | 5.1% |
| Dec 2015 | 26.8% | 5.0% |
| Jan 2016 | 27.1% | 4.8% |
| Feb 2016 | 27.8% | 4.9% |
| Mar 2016 | 28.0% | 5.0% |
| Apr 2016 | 26.6% | 5.1% |
| May 2016 | 25.5% | 4.8% |
| Jun 2016 | 25.8% | 4.9% |
| Jul 2016 | 25.4% | 4.8% |
| Aug 2016 | 25.6% | 4.9% |
| Sep 2016 | 24.2% | 5.0% |
| Oct 2016 | 24.8% | 4.9% |
| Nov 2016 | 24.7% | 4.7% |
| Dec 2016 | 24.6% | 4.7% |
| Jan 2017 | 24.8% | 4.7% |
| Feb 2017 | 24.1% | 4.6% |
| Mar 2017 | 23.6% | 4.4% |
| Apr 2017 | 24.1% | 4.4% |
| May 2017 | 25.0% | 4.4% |
| Jun 2017 | 24.3% | 4.3% |
| Jul 2017 | 25.2% | 4.3% |
| Aug 2017 | 23.7% | 4.4% |
| Sep 2017 | 24.5% | 4.3% |
| Oct 2017 | 24.3% | 4.2% |
| Nov 2017 | 23.6% | 4.2% |
| Dec 2017 | 22.8% | 4.1% |
| Jan 2018 | 22.5% | 4.0% |
| Feb 2018 | 21.5% | 4.1% |
| Mar 2018 | 20.9% | 4.0% |
| Apr 2018 | 21.5% | 4.0% |
| May 2018 | 20.2% | 3.8% |
| Jun 2018 | 21.9% | 4.0% |
| Jul 2018 | 22.9% | 3.8% |
| Aug 2018 | 20.6% | 3.8% |
| Sep 2018 | 22.2% | 3.7% |
| Oct 2018 | 21.9% | 3.8% |
| Nov 2018 | 20.1% | 3.8% |
| Dec 2018 | 20.3% | 3.9% |
| Jan 2019 | 19.8% | 4.0% |
| Feb 2019 | 20.7% | 3.8% |
| Mar 2019 | 20.4% | 3.8% |
| Apr 2019 | 21.0% | 3.7% |
| May 2019 | 22.6% | 3.6% |
| Jun 2019 | 22.7% | 3.6% |
| Jul 2019 | 20.2% | 3.7% |
| Aug 2019 | 20.7% | 3.6% |
| Sep 2019 | 23.2% | 3.5% |
| Oct 2019 | 21.9% | 3.6% |
| Nov 2019 | 20.5% | 3.6% |
| Dec 2019 | 20.2% | 3.6% |
| Jan 2020 | 20.0% | 3.6% |
| Feb 2020 | 19.2% | 3.5% |
| Mar 2020 | 15.9% | 4.4% |
| Apr 2020 | 4.0% | 14.8% |
| May 2020 | 5.5% | 13.2% |
| Jun 2020 | 7.7% | 11.0% |
| Jul 2020 | 9.5% | 10.2% |
| Aug 2020 | 12.0% | 8.4% |
| Sep 2020 | 19.3% | 7.8% |
| Oct 2020 | 32.5% | 6.9% |
| Nov 2020 | 36.5% | 6.7% |
| Dec 2020 | 36.7% | 6.7% |
| Jan 2021 | 39.8% | 6.4% |
| Feb 2021 | 41.7% | 6.2% |
| Mar 2021 | 42.9% | 6.1% |
| Apr 2021 | 42.0% | 6.1% |
| May 2021 | 40.4% | 5.8% |
| Jun 2021 | 42.0% | 5.9% |
| Jul 2021 | 39.8% | 5.4% |
| Aug 2021 | 38.1% | 5.1% |
| Sep 2021 | 35.3% | 4.7% |
| Oct 2021 | 32.5% | 4.5% |
| Nov 2021 | 32.4% | 4.2% |
| Dec 2021 | 31.3% | 3.9% |
| Jan 2022 | 25.2% | 4.0% |
| Feb 2022 | 26.7% | 3.8% |
| Mar 2022 | 23.0% | 3.7% |
| Apr 2022 | 23.5% | 3.7% |
| May 2022 | 22.2% | 3.6% |
| Jun 2022 | 23.0% | 3.6% |
| Jul 2022 | 19.4% | 3.5% |
| Aug 2022 | 20.3% | 3.6% |
| Sep 2022 | 19.4% | 3.5% |
| Oct 2022 | 20.3% | 3.6% |
| Nov 2022 | 20.9% | 3.6% |
| Dec 2022 | 18.6% | 3.5% |
| Jan 2023 | 18.9% | 3.5% |
| Feb 2023 | 17.6% | 3.6% |
| Mar 2023 | 18.1% | 3.5% |
| Apr 2023 | 19.1% | 3.4% |
| May 2023 | 19.0% | 3.6% |
| Jun 2023 | 18.9% | 3.6% |
| Jul 2023 | 20.3% | 3.5% |
| Aug 2023 | 21.3% | 3.7% |
| Sep 2023 | 19.4% | 3.8% |
| Oct 2023 | 20.5% | 3.9% |
| Nov 2023 | 18.6% | 3.7% |
| Dec 2023 | 20.1% | 3.8% |
| Jan 2024 | 20.7% | 3.7% |
| Feb 2024 | 18.8% | 3.9% |
| Mar 2024 | 19.5% | 3.9% |
| Apr 2024 | 19.6% | 3.9% |
| May 2024 | 20.6% | 4.0% |
| Jun 2024 | 22.4% | 4.1% |
| Jul 2024 | 21.6% | 4.2% |
| Aug 2024 | 21.5% | 4.2% |
| Sep 2024 | 23.5% | 4.1% |
| Oct 2024 | 22.9% | 4.1% |
| Nov 2024 | 23.1% | 4.2% |
| Dec 2024 | 22.4% | 4.1% |
| Jan 2025 | 21.1% | 4.0% |
| Feb 2025 | 20.9% | 4.1% |
| Mar 2025 | 21.3% | 4.2% |
| Apr 2025 | 23.5% | 4.2% |
| May 2025 | 20.4% | 4.2% |
| Jun 2025 | 23.3% | 4.1% |
| Jul 2025 | 24.9% | 4.2% |
| Aug 2025 | 25.7% | 4.3% |
A similar lag appeared after the 2020 pandemic shock: overall unemployment fell below 7% by late 2020, yet long-term joblessness did not peak until February 2021.
This pattern underscores how scarring effects from layoffs (skill erosion, résumé gaps, and discouragement) can persist long after economic output starts to rebound.
2025’s Unemployment Uptick Mirrors Early-Recession Dynamics
The long-term unemployment rate’s jump from 21.5% in August 2024 to 25.7% in August 2025 is the fastest 12-month increase since the pandemic.
Historically, a breach of the 25% threshold has coincided with or preceded recessions, as seen in 2009.
And while today’s 4.3% headline unemployment rate remains below its long-term average, the rapid rise in entrenched joblessness suggests underlying weakness in the labor market that headline figures can mask.
 Related: Take a look at the industries hiring and firing the most workers in 2025.
Why Long-Term Unemployment Matters
Extended joblessness weighs on both workers and the broader economy.
Research shows earnings losses can linger for a decade after a long jobless spell, while communities with high long-term unemployment see lower consumer spending and higher demands on social safety nets.
For policymakers, the metric offers a window into labor-market slack that straightforward unemployment counts may miss.
Learn More on the Voronoi App 
If you enjoyed today’s post, check out Which Jobs Use AI the Most? on Voronoi, the new app from Visual Capitalist.
- Source: https://www.visualcapitalist.com/charted-20-years-of-long-term-unemployment-in-the-u-s-2005-2025/