 See visualizations like this on the Voronoi app.
Charted: Sinking Fertility Rates in the World’s 10 Largest Countries
See visuals like this from hundreds of other data creators on our Voronoi app. Download the app for free on iOS or Android and discover incredible data-driven charts from a variety of trusted sources.
Key Takeaways
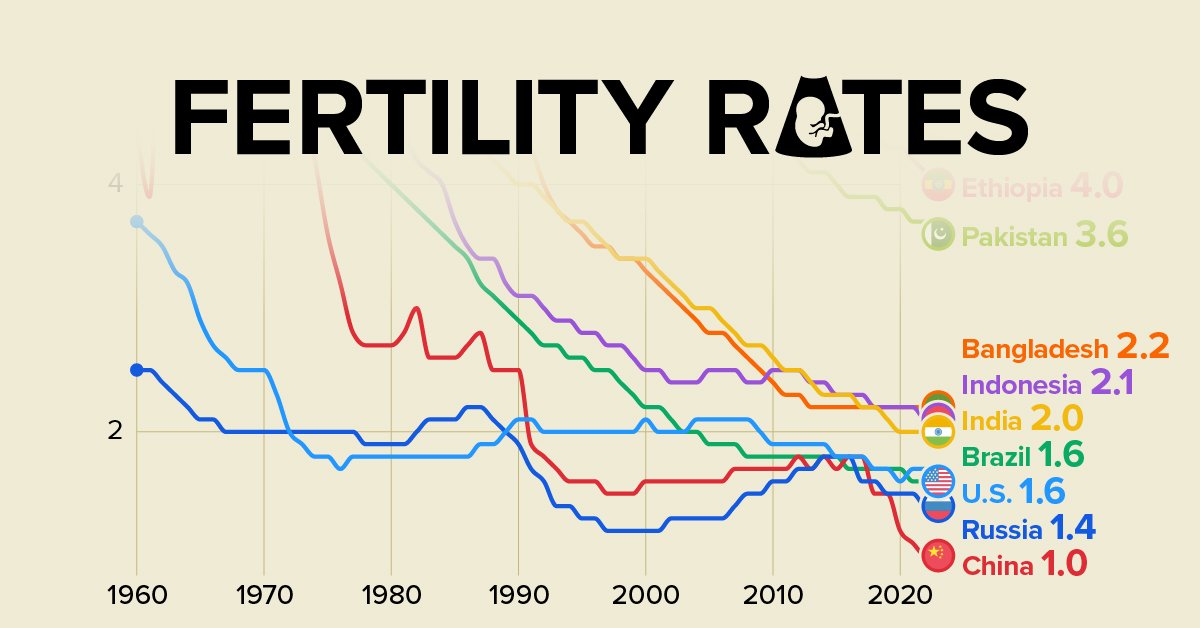
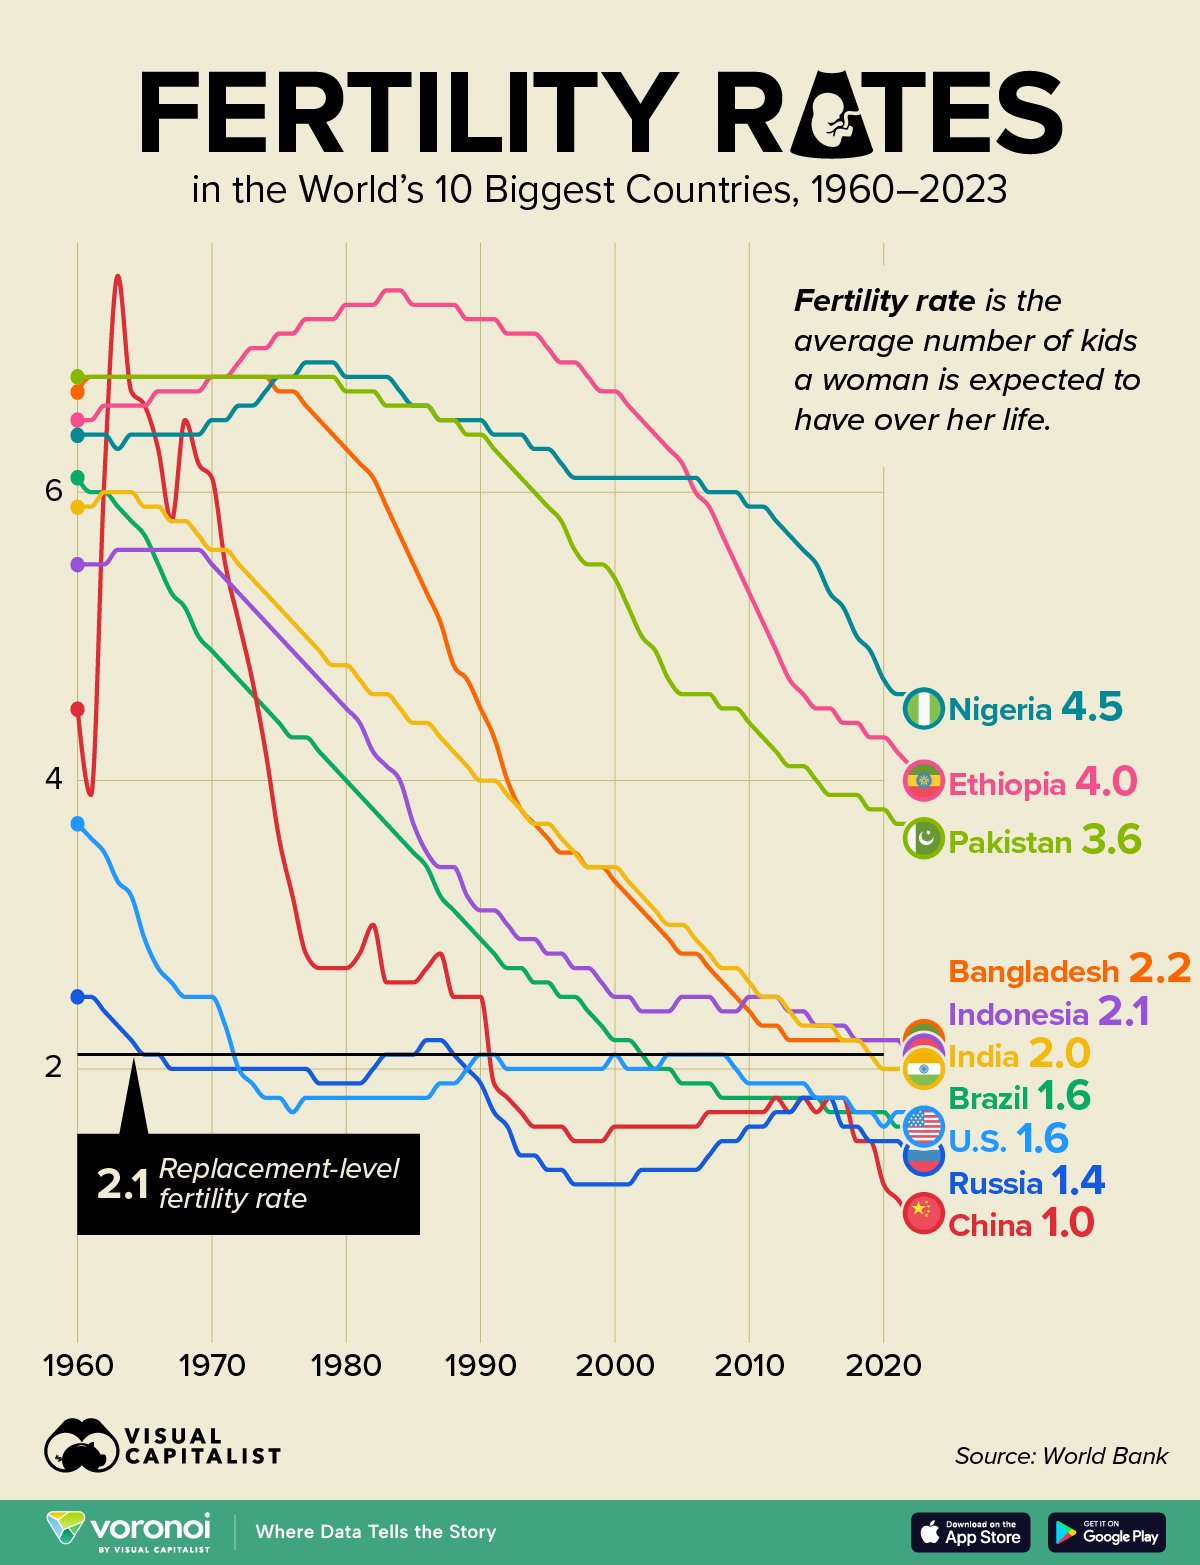
- Five of the world’s 10 largest countries have fallen below the replacement fertility rate (2.1 births per woman), highlighting a global shift towards aging and population decline.
- China now has one of the lowest fertility rates in the world, at just 1.0 birth per woman as of 2023.
Over the last half-century, fertility rates have collapsed around the globe. This demographic shift will result in a shrinking workforce, potentially adding a burden to pension and healthcare systems.
In this infographic, we visualize global fertility decline from 1960 through 2023, focusing on the world’s 10 biggest nation.
Data & Discussion
The data for this visualization comes from World Bank. It tracks the fertility rate (the average number of children a woman would have over her lifetime) across the world’s 10 biggest nations.
The replacement-level fertility rate (2.1 births per woman) was included in the chart for further context. It represents the average number of children a woman must have for a population to replace itself without migration.
| Country | 1960 | 1970 | 1980 | 1990 | 2000 | 2010 | 2020 | 2023 |
|---|---|---|---|---|---|---|---|---|
 Nigeria Nigeria |
6.4 | 6.5 | 6.8 | 6.5 | 6.1 | 5.9 | 4.7 | 4.5 |
 Ethiopia Ethiopia |
6.5 | 6.8 | 7.3 | 7.2 | 6.7 | 5.3 | 4.3 | 4.0 |
 Pakistan Pakistan |
6.8 | 6.8 | 6.7 | 6.4 | 5.4 | 4.4 | 3.8 | 3.6 |
 World Avg World Avg |
4.7 | 4.8 | 3.7 | 3.3 | 2.7 | 2.6 | 2.3 | 2.2 |
 Bangladesh Bangladesh |
6.7 | 6.8 | 6.3 | 4.5 | 3.3 | 2.4 | 2.2 | 2.2 |
 Indonesia Indonesia |
5.5 | 5.5 | 4.5 | 3.1 | 2.5 | 2.5 | 2.2 | 2.1 |
 India India |
5.9 | 5.6 | 4.8 | 4.0 | 3.4 | 2.6 | 2.0 | 2.0 |
 Brazil Brazil |
6.1 | 4.9 | 4.0 | 2.9 | 2.2 | 1.8 | 1.7 | 1.6 |
 U.S. U.S. |
3.7 | 2.5 | 1.8 | 2.1 | 2.1 | 1.9 | 1.6 | 1.6 |
 Russia Russia |
2.5 | 2.0 | 1.9 | 1.9 | 1.2 | 1.6 | 1.5 | 1.4 |
 China China |
4.5 | 6.1 | 2.7 | 2.5 | 1.6 | 1.7 | 1.2 | 1.0 |
Declining Fertility Rates in China & India
China and India, the world’s two most populous countries, once had fertility rates above 6 births per woman.
Today, India has dropped to 2.0, while China has fallen even further to just 1.0. China’s decline is among the steepest globally, accelerated by its one-child policy (1979–2015) and now by economic and social pressures.
These trends raise concerns about shrinking workforces and rising dependency ratios.
America Remains Below Replacement-Level Fertility
Following a steep decline throughout the 60s and 70s, America’s fertility rate has hovered slightly below the replacement-level fertility rate for many decades.
This decline is due to a mix of social and economic changes:
- More women entering higher education and the labor force
- Postponed marriages and childbearing
- Rising costs of housing, childcare, and education
- Evolving personal preferences that prioritize career, flexibility, or fewer children.
These trends are already posing major challenges. A recent study found that there are 5.7 million more childless U.S. women of prime childbearing age than would have been expected if pre-Great Recession fertility patterns held steady, contributing to what the authors call a looming “demographic cliff.”
In fact, U.S. population growth is now almost entirely driven by immigration, as births alone are no longer enough to offset the nation’s below-replacement fertility rate.
Learn More on the Voronoi App
If you enjoyed today’s post, check out 63 Countries Have Already Reached Peak Population on Voronoi, the new app from Visual Capitalist.
- Source: https://www.visualcapitalist.com/charted-sinking-fertility-rates-in-the-worlds-10-largest-countries/