Stocks vs. Real Estate: 75 Years of U.S. Household Wealth
Key Takeaways
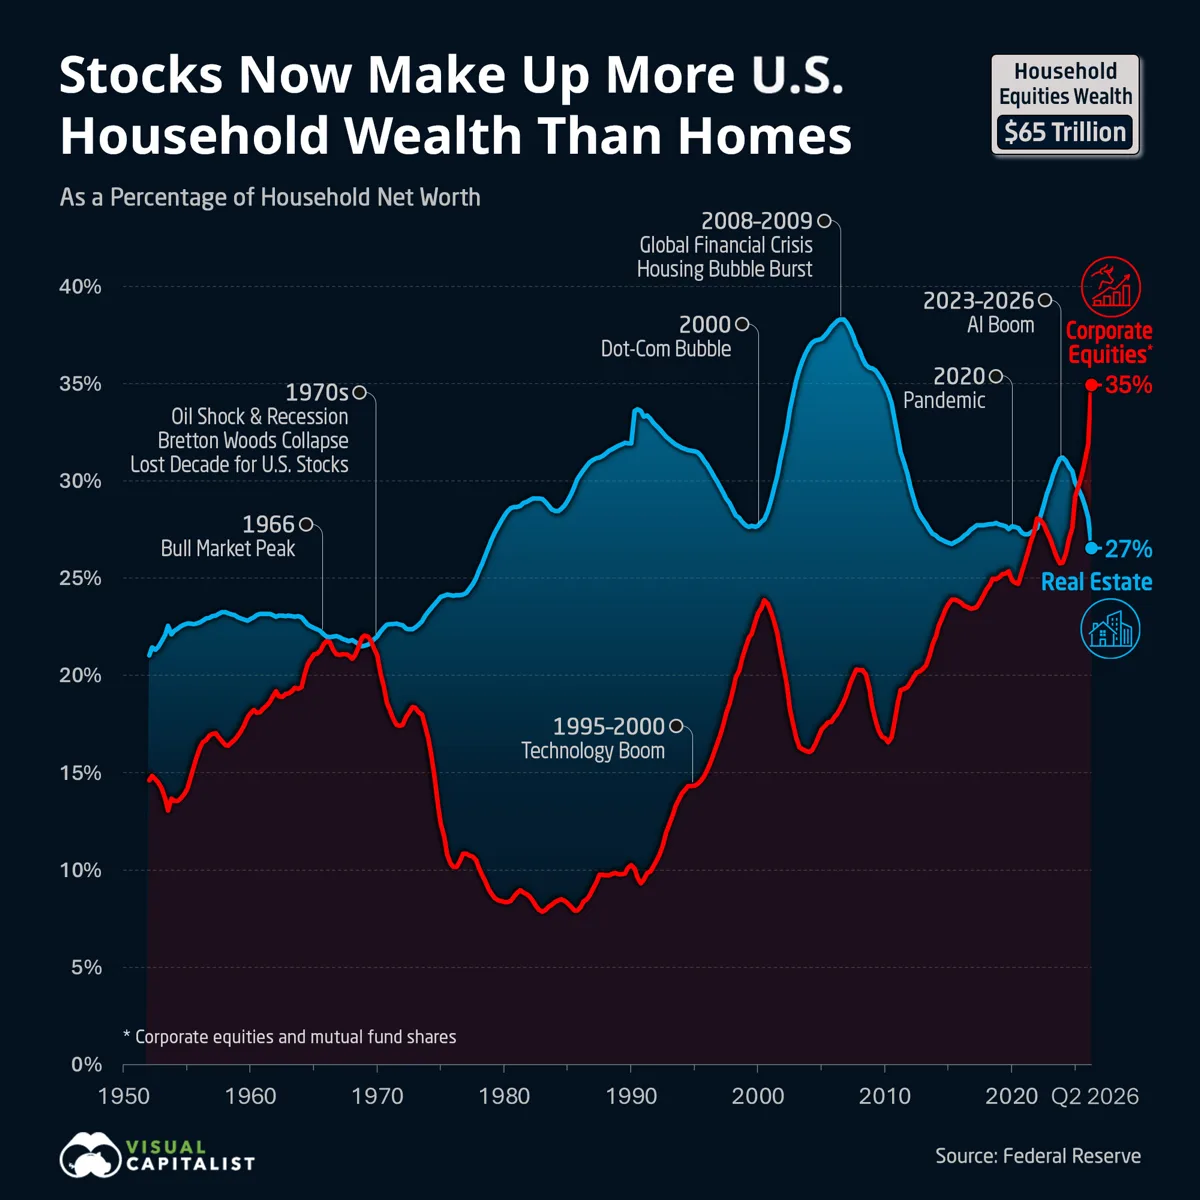
- Stocks and mutual funds make up 35% of U.S. household net worth in 2026, ahead of real estate at 27%, the widest lead for stocks in Federal Reserve data going back to the 1950s.
- In the late 1960s, stocks briefly overtook real estate, reaching about 22% of household net worth before the 1970s bear market pushed their share down to 8% by the early 1980s.
For most of the past 75 years, Americans had more of their wealth tied up in homes than in the stock market. Stocks have now taken the lead, even as the total value of household real estate has continued to rise.
Stocks previously overtook real estate in the late 1960s and briefly again in the early 2020s, but neither lead lasted.
This graphic tracks corporate equities and mutual funds alongside real estate as a share of U.S. household net worth since 1952, using data from the Federal Reserve.
How Stocks and Real Estate Compare in U.S. Household Wealth
In Q2 2026, U.S. households held $64.6 trillion in stocks and mutual funds, compared with $49.8 trillion in real estate. That amounts to a $14.8 trillion gap between the two asset classes.
The widening gap reflects faster growth in stock holdings, largely driven by surging valuations, rather than a decline in real estate wealth. Since Q1 2023, stock holdings have grown 82%, compared with an 18% increase in real estate wealth.
The table below shows both assets’ shares of U.S. household net worth every five years since 1952:
| Year (Q2) | Share of U.S. Household Net Worth (%) | |
|---|---|---|
| Real Estate | Corporate Equities and Mutual Funds | |
| 2026 | 26.8 | 34.8 |
| 2025 | 29.6 | 29.7 |
| 2020 | 27.6 | 24.8 |
| 2015 | 26.8 | 23.9 |
| 2010 | 34.5 | 16.6 |
| 2005 | 37.5 | 17.4 |
| 2000 | 27.9 | 23.5 |
| 1995 | 31.5 | 14.4 |
| 1990 | 33.6 | 10.1 |
| 1985 | 29.3 | 8.1 |
| 1980 | 28.4 | 8.3 |
| 1975 | 24.1 | 11.7 |
| 1970 | 22.3 | 20.1 |
| 1965 | 22.4 | 21.1 |
| 1960 | 23.0 | 18.2 |
| 1955 | 22.7 | 14.7 |
| 1952 | 21.5 | 14.8 |
Figures for 1952–1985 are from the Fed’s Financial Accounts; figures from 1990 onward are from its Distributional Financial Accounts.
The latest quarter in the series widened stocks’ lead significantly, as household stock holdings rose $9.4 trillion in Q2 2026, compared with $1.1 trillion for real estate. The S&P 500 rose more than 14% in its best quarter since 2020, with chipmakers helping drive the rally.
Seven Decades of Booms and Busts in Stocks and Real Estate
Over the past seven decades, stock market rallies, housing booms, and economic downturns have reshaped the composition of U.S. household wealth.
Stocks first overtook homes in the late 1960s, when a long bull market lifted their share to about 22% of household net worth. That lead lasted barely a year. The 1970s then brought two oil shocks, recessions, and double-digit inflation, with stocks losing value after adjusting for inflation over the decade.
By the early 1980s, stocks had fallen to just 8% of household net worth. The technology boom of the 1990s reversed that trend, nearly tripling their share before the dot-com crash erased much of those gains.
Real estate’s share of U.S. household wealth reached its peak of 38% during the housing bubble in 2006.
Unlike previous periods when stocks briefly overtook real estate, today’s lead is substantially wider. Whether that gap persists will depend on how the stock and housing markets perform in the years ahead.
Learn More on the Voronoi App
If you enjoyed today’s post, check out Corporate Equity Tops Home Equity by $10.1T on Voronoi.