Charted: The Global Trade in European Antiques
Key Takeaways
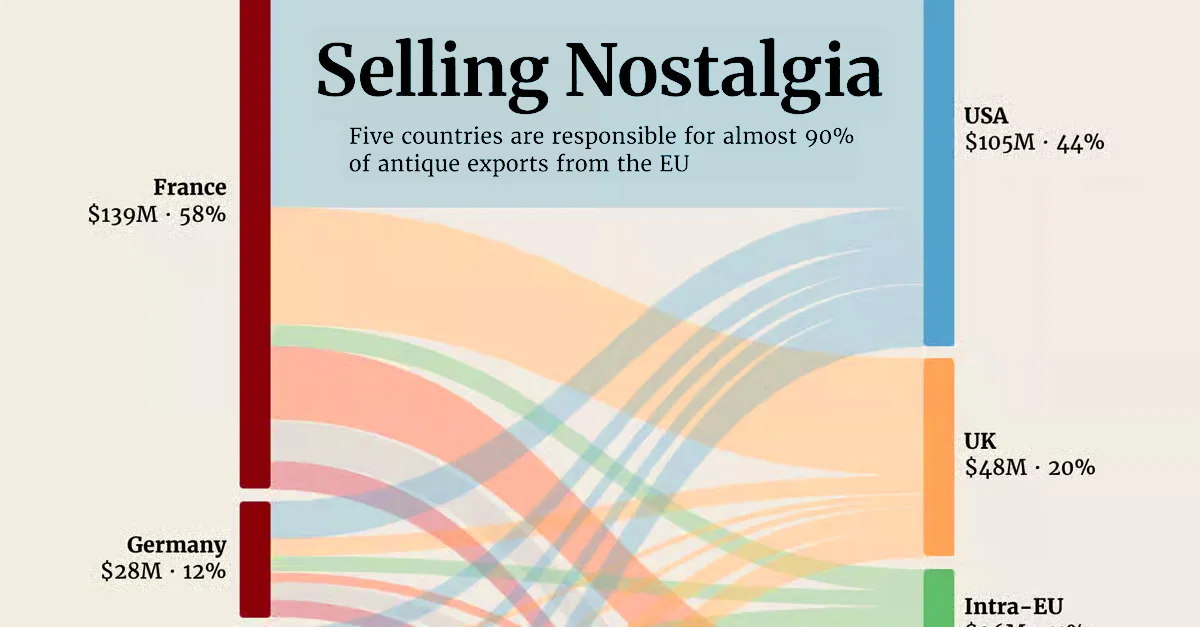
- France supplies 58% of EU antique exports, dominating the market.
- The U.S. is the top buyer, importing 44% of Europe’s antiques.
- Just five countries account for nearly 90% of EU exports, highlighting how concentrated the trade is.
The global trade in European antiques is dominated by a few key players on both sides of the market.
France leads exports by a wide margin, while the United States is the largest destination for these goods.
Based on UN Comtrade data and visualized by The European Correspondent, this flow chart shows how antiques, defined here as objects over 100 years old, move from European sellers to buyers around the world.
France Dominates Europe’s Antique Exports
Here are the top exporters of European antiquities by value:
| Top Exporters | Trade Value (USD) | Market Share (%) |
|---|---|---|
 France France |
$139M | 58% |
 Germany Germany |
$28M | 12% |
 Netherlands Netherlands |
$15M | 6% |
 Austria Austria |
$14M | 6% |
 Belgium Belgium |
$14M | 6% |
 Others EU Others EU |
$30M | 12% |
France is the clear leader in Europe’s antique export market, accounting for 58% of total exports at $139 million, more than all other countries combined.
This dominance reflects several structural advantages. Paris remains one of the world’s top auction hubs, with a dense network of galleries, dealers, and auction houses that facilitate global sales. France also holds a vast inventory of cultural assets, from fine art and furniture to rare collectibles built over centuries of artistic and political influence.
Other European countries like Germany, the Netherlands, and Austria participate in the market, but at a much smaller scale. Their comparatively limited export values highlight how concentrated the supply side is, with France acting as the primary gateway for European heritage entering global markets.
Who’s Buying Europe’s Past?
Here are the top importers of European antiquities:
| Top Importers | Trade Value (USD) | Market Share (%) |
|---|---|---|
 United States United States |
$105M | 44% |
 UK UK |
$48M | 20% |
| Intra-EU |
$26M | 11% |
 China / China /  Hong Kong Hong Kong |
$25M | 10% |
 Switzerland Switzerland |
$15M | 6% |
 Other Other |
$21M | 9% |
The United States leads by a wide margin, importing $105 million worth of antiques, or 44% of the total. The UK ranks second, followed by intra-EU trade and Asian markets like China and Hong Kong.
This aligns with broader trends in the global art market. American collectors and institutions remain key drivers of demand for cultural assets.
Meanwhile, policy changes, such as evolving tariffs on antiques and auction items, could influence future flows. While many antiques have historically benefited from favorable trade treatment, shifts in regulation may affect both buyers and sellers in the coming years.