China Added More Solar Than the Rest of the World Combined
See visuals like this from many other data creators on our Voronoi app. Download it for free on iOS or Android and discover incredible data-driven charts from a variety of trusted sources.
Key Takeaways
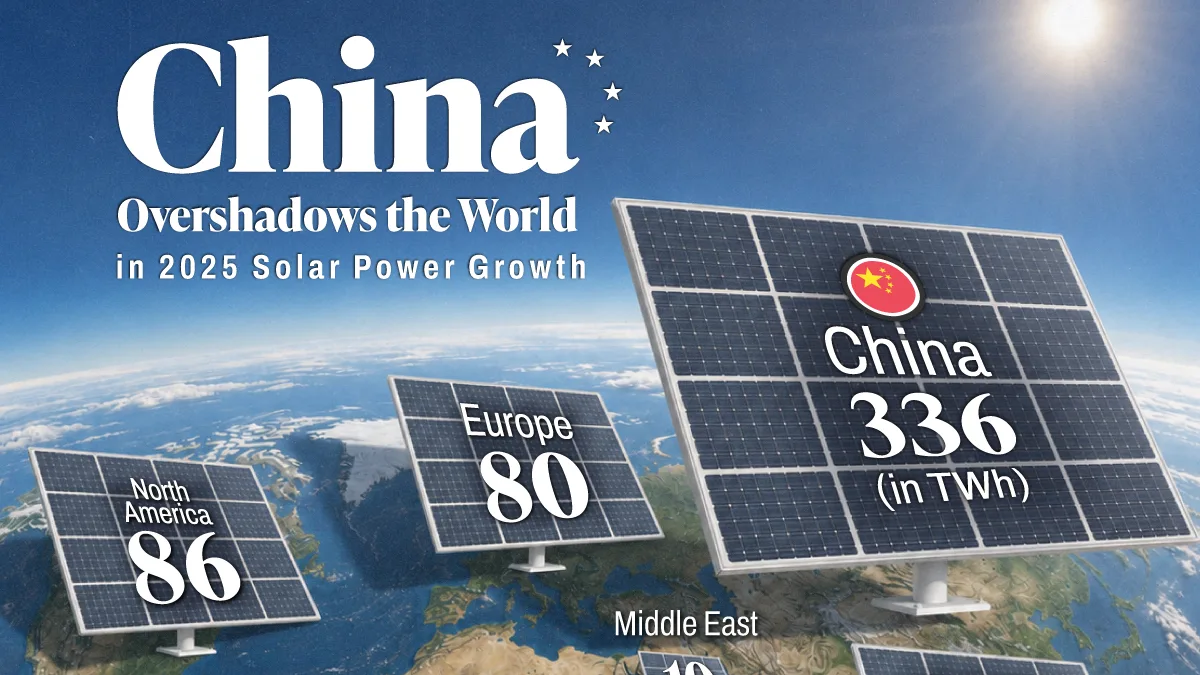
- China added 336 TWh of new solar generation in 2025, more than the rest of the world combined (300 TWh).
- China accounted for 53% of all global solar additions, helping solar meet 75% of worldwide electricity demand growth.
- Asia outside China, North America, and Europe each added around 80–90 TWh, highlighting the scale gap between China and every other region.
Solar power continued its record expansion in 2025, becoming the largest source of new electricity generation worldwide and meeting 75% of global demand growth.
The pace of deployment also helped drive a rare milestone: global fossil fuel generation declined even as electricity demand increased. According to Ember’s Global Electricity Review 2026, rapid clean power additions in China and India were a major reason why.
This map shows where new solar generation was added in 2025, highlighting the regions leading the world’s energy transition.
China vs. the World
China added 336 terawatt-hours (TWh) of new solar generation in 2025, exceeding the combined total of every other region.
To put that scale into perspective, China’s solar additions in a single year were greater than all of the electricity the United Kingdom used in 2025 (322 TWh).
The data table below breaks down solar additions in 2025 by region, along with China:
| Country/Region | 2025 Solar Power Additions (TWh) |
|---|---|
| China | 336 |
| Asia (ex. China) | 90 |
| North America | 86 |
| Europe | 80 |
| Latin America & Caribbean | 24 |
| Middle East | 10 |
| Oceania | 6 |
| Africa | 4 |
Excluding China, the rest of the world accounted for 300 TWh of new solar additions. Asia outside China added the second-largest amount of solar with 90 TWh, followed by North America at 86 TWh and Europe at 80 TWh.
Why China’s Scale Matters
The scale of China’s electricity deployment has global implications. In 2025, global fossil fuel generation fell, which according to Ember, may be the first time this has happened without an economic recession or stagnation as the leading cause.
Fossil fuel generation reductions were led by China (-56 TWh) and India (-52 TWh), driven by each country’s rapid clean power deployment. This was despite moderate fossil fuel generation increases in the U.S., EU, and other regions.
China dominates the solar supply chain, allowing it to leverage its production scale to lower costs and accelerate adoption. However, this makes the global energy transition more exposed to Chinese policy, trade rules, and manufacturing capacity.
Global Solar Power Additions Are Soaring
It was a record-setting year as the world added 636 TWh of solar power, beating the previous solar record in 2024 (+479 TWh) by 33%. This is the fourth year in a row that solar has had the largest absolute growth of any electricity source.
Coal is the only electricity source to have a larger recorded annual increase in recent years, after generation jumped by 719 TWh following the pandemic in 2021.
However, coal’s expansion was driven by a rebound in demand, unlike solar’s structural capacity expansion.
Learn More on the Voronoi App 
If you enjoyed this graphic, make sure to check out this graphic that shows how global coal consumption is still rising.