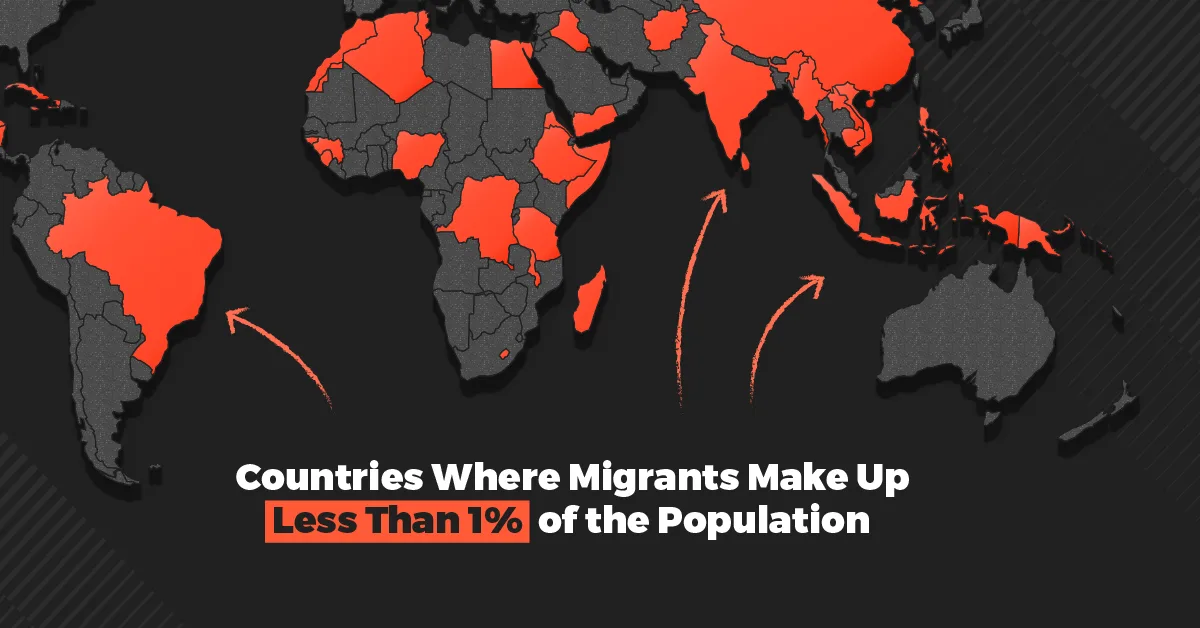
Countries Where Migrants Make Up <1% of the Population
Key Takeaways
- In 43 countries and territories, international migrants account for less than 1% of the population.
- Nearly three-fifths of the world’s population lives in these low-immigration countries, including China, India, Indonesia, and Nigeria.
- Across 81 countries and territories, migrants make up less than 3% of the population, showing how concentrated global migration remains.
Migration debates often focus on countries that receive large numbers of newcomers. Across much of the world, however, immigrants remain exceptionally rare.
Using 2024 data from the UN Population Division’s International Migrant Stock, this map highlights countries and territories where foreign-born residents make up less than 1% of the population.
Where Migrant Populations Are Rare
Here is the full dataset showing international migrants as a share of each country or territory’s population:
| Country/Territory | Migrant population share (%, 2024) |
|---|---|
 Cuba Cuba |
0.02 |
 Philippines Philippines |
0.08 |
 China China |
0.12 |
 Madagascar Madagascar |
0.12 |
 Myanmar Myanmar |
0.15 |
 Indonesia Indonesia |
0.16 |
 Haiti Haiti |
0.17 |
 Sri Lanka Sri Lanka |
0.18 |
 North Korea North Korea |
0.19 |
 Afghanistan Afghanistan |
0.23 |
 Morocco Morocco |
0.29 |
 Papua New Guinea Papua New Guinea |
0.29 |
 Solomon Islands Solomon Islands |
0.30 |
 Vietnam Vietnam |
0.32 |
 India India |
0.33 |
 Eritrea Eritrea |
0.35 |
 Honduras Honduras |
0.37 |
 Somalia Somalia |
0.41 |
 Cambodia Cambodia |
0.48 |
 Guatemala Guatemala |
0.50 |
 Tunisia Tunisia |
0.51 |
 Algeria Algeria |
0.55 |
 Sierra Leone Sierra Leone |
0.58 |
 Timor-Leste Timor-Leste |
0.59 |
 Nigeria Nigeria |
0.60 |
 Nicaragua Nicaragua |
0.63 |
 Lesotho Lesotho |
0.64 |
 Mongolia Mongolia |
0.65 |
 Laos Laos |
0.66 |
 Brazil Brazil |
0.66 |
 Tanzania Tanzania |
0.67 |
 El Salvador El Salvador |
0.68 |
 Guinea-Bissau Guinea-Bissau |
0.68 |
 Guinea Guinea |
0.80 |
 Iraq Iraq |
0.81 |
 Sao Tome and Principe Sao Tome and Principe |
0.83 |
 Jamaica Jamaica |
0.85 |
 Malawi Malawi |
0.86 |
 Ethiopia Ethiopia |
0.88 |
 Western Sahara Western Sahara |
0.95 |
 Yemen Yemen |
0.97 |
 Egypt Egypt |
0.98 |
 DR Congo DR Congo |
0.99 |
 Vanuatu Vanuatu |
1.01 |
 Mozambique Mozambique |
1.02 |
 Bosnia and Herzegovina Bosnia and Herzegovina |
1.08 |
 Zambia Zambia |
1.17 |
 Liberia Liberia |
1.29 |
 Mexico Mexico |
1.32 |
 Comoros Comoros |
1.44 |
 Bolivia Bolivia |
1.48 |
 Senegal Senegal |
1.52 |
 Ghana Ghana |
1.55 |
 Fiji Fiji |
1.55 |
 Nepal Nepal |
1.59 |
 Albania Albania |
1.66 |
 Niger Niger |
1.66 |
 Pakistan Pakistan |
1.66 |
 Bangladesh Bangladesh |
1.67 |
 Kenya Kenya |
1.76 |
 Samoa Samoa |
1.76 |
 Central African Republic Central African Republic |
1.77 |
 Angola Angola |
1.79 |
 Azerbaijan Azerbaijan |
2.11 |
 Georgia Georgia |
2.14 |
 Cameroon Cameroon |
2.21 |
 Mali Mali |
2.23 |
 Mauritius Mauritius |
2.29 |
 Kiribati Kiribati |
2.45 |
 Tuvalu Tuvalu |
2.55 |
 Micronesia Micronesia |
2.56 |
 Zimbabwe Zimbabwe |
2.58 |
 Turkmenistan Turkmenistan |
2.59 |
 Paraguay Paraguay |
2.61 |
 Tajikistan Tajikistan |
2.61 |
 Eswatini Eswatini |
2.68 |
 Kyrgyzstan Kyrgyzstan |
2.71 |
 Japan Japan |
2.76 |
 Burundi Burundi |
2.76 |
 Benin Benin |
2.89 |
 Togo Togo |
2.96 |
 Burkina Faso Burkina Faso |
3.14 |
 Cape Verde Cape Verde |
3.15 |
 Uzbekistan Uzbekistan |
3.18 |
 Tonga Tonga |
3.44 |
 Romania Romania |
3.45 |
 South Korea South Korea |
3.50 |
 Rwanda Rwanda |
3.60 |
 Syria Syria |
3.63 |
 Mauritania Mauritania |
3.79 |
 Namibia Namibia |
3.83 |
 South Africa South Africa |
4.11 |
 Uganda Uganda |
4.11 |
 Ecuador Ecuador |
4.12 |
 Iran Iran |
4.19 |
 Argentina Argentina |
4.28 |
 Bulgaria Bulgaria |
4.43 |
 Thailand Thailand |
4.44 |
 Venezuela Venezuela |
4.45 |
 Saint Lucia Saint Lucia |
4.49 |
 Poland Poland |
4.51 |
 Botswana Botswana |
4.62 |
 Uruguay Uruguay |
4.73 |
 Sudan Sudan |
4.75 |
 Saint Vincent and the Grenadines Saint Vincent and the Grenadines |
4.79 |
 Taiwan Taiwan |
4.90 |
 Palestine Palestine |
4.96 |
 Russia Russia |
5.25 |
 Peru Peru |
5.37 |
 Colombia Colombia |
5.79 |
 Slovakia Slovakia |
5.88 |
 Congo Congo |
6.09 |
 Lithuania Lithuania |
6.13 |
 Moldova Moldova |
6.20 |
 Chad Chad |
6.25 |
 Grenada Grenada |
6.26 |
 Dominican Republic Dominican Republic |
6.46 |
 Guyana Guyana |
6.52 |
 Puerto Rico Puerto Rico |
6.89 |
 Bhutan Bhutan |
7.04 |
 Hungary Hungary |
7.13 |
 Trinidad and Tobago Trinidad and Tobago |
7.53 |
 South Sudan South Sudan |
7.65 |
 Chile Chile |
7.78 |
 Türkiye Türkiye |
8.10 |
 Suriname Suriname |
8.18 |
 North Macedonia North Macedonia |
8.28 |
 Gambia Gambia |
8.56 |
 Marshall Islands Marshall Islands |
8.81 |
 Côte d’Ivoire Côte d’Ivoire |
9.02 |
 Finland Finland |
9.16 |
 Armenia Armenia |
9.24 |
 Saint Helena Saint Helena |
9.39 |
 Czechia Czechia |
9.55 |
 Kazakhstan Kazakhstan |
10.15 |
 Seychelles Seychelles |
10.17 |
 Greenland Greenland |
10.41 |
 Serbia Serbia |
10.58 |
 Panama Panama |
10.58 |
 French Polynesia French Polynesia |
10.68 |
 Malaysia Malaysia |
10.71 |
 Djibouti Djibouti |
10.78 |
 Portugal Portugal |
10.81 |
 Italy Italy |
11.04 |
 Belarus Belarus |
11.64 |
 Latvia Latvia |
11.78 |
 Libya Libya |
12.16 |
 Costa Rica Costa Rica |
12.25 |
 Barbados Barbados |
12.46 |
 Dominica Dominica |
12.75 |
 Equatorial Guinea Equatorial Guinea |
13.15 |
 Ukraine Ukraine |
13.38 |
 Croatia Croatia |
13.62 |
 France France |
13.80 |
 Greece Greece |
14.17 |
 Denmark Denmark |
14.18 |
 Maldives Maldives |
14.23 |
 Montenegro Montenegro |
14.45 |
 Faroe Islands Faroe Islands |
14.62 |
 Slovenia Slovenia |
14.87 |
 Cyprus Cyprus |
14.88 |
 Estonia Estonia |
14.92 |
 United States United States |
15.16 |
 Réunion Réunion |
15.43 |
 Netherlands Netherlands |
16.22 |
 Belize Belize |
16.47 |
 Bahamas Bahamas |
16.77 |
 Saint Kitts and Nevis Saint Kitts and Nevis |
16.99 |
 United Kingdom United Kingdom |
17.13 |
 San Marino San Marino |
17.38 |
 Gabon Gabon |
17.71 |
 Saint Pierre and Miquelon Saint Pierre and Miquelon |
17.91 |
 Wallis and Futuna Wallis and Futuna |
18.02 |
 Norway Norway |
18.15 |
 Spain Spain |
18.51 |
 Germany Germany |
19.81 |
 Martinique Martinique |
19.87 |
 Belgium Belgium |
20.01 |
 Nauru Nauru |
21.33 |
 Sweden Sweden |
21.42 |
 Canada Canada |
22.16 |
 Israel Israel |
22.28 |
 Ireland Ireland |
23.14 |
 Guadeloupe Guadeloupe |
23.89 |
 Lebanon Lebanon |
24.50 |
 Iceland Iceland |
25.12 |
 Austria Austria |
25.51 |
 Brunei Brunei |
25.92 |
 New Caledonia New Caledonia |
26.22 |
 New Zealand New Zealand |
28.16 |
 Gibraltar Gibraltar |
28.71 |
 Palau Palau |
29.45 |
 Australia Australia |
30.36 |
 Switzerland Switzerland |
31.09 |
 Bermuda Bermuda |
31.21 |
 Montserrat Montserrat |
31.94 |
 Niue Niue |
32.33 |
 Antigua and Barbuda Antigua and Barbuda |
32.50 |
 Cook Islands Cook Islands |
35.96 |
 Malta Malta |
36.97 |
 Saudi Arabia Saudi Arabia |
40.29 |
 Anguilla Anguilla |
40.54 |
 Hong Kong Hong Kong |
41.31 |
 French Guiana French Guiana |
42.44 |
 Cayman Islands Cayman Islands |
42.89 |
 Curaçao Curaçao |
43.14 |
 Oman Oman |
43.23 |
 Mayotte Mayotte |
43.96 |
 Jordan Jordan |
45.70 |
 Singapore Singapore |
48.72 |
 Northern Mariana Islands Northern Mariana Islands |
49.69 |
 Guam Guam |
50.16 |
 American Samoa American Samoa |
50.64 |
 Tokelau Tokelau |
51.16 |
 Luxembourg Luxembourg |
51.16 |
 Isle of Man Isle of Man |
51.92 |
 Bahrain Bahrain |
52.28 |
 Andorra Andorra |
59.08 |
 Macau Macau |
59.26 |
 Turks and Caicos Islands Turks and Caicos Islands |
61.15 |
 British Virgin Islands British Virgin Islands |
62.12 |
 U.S. Virgin Islands U.S. Virgin Islands |
66.87 |
 Falkland Islands (Malvinas) Falkland Islands (Malvinas) |
67.23 |
 Kuwait Kuwait |
67.35 |
 Aruba Aruba |
68.01 |
 Liechtenstein Liechtenstein |
69.40 |
 Sint Maarten (Dutch part) Sint Maarten (Dutch part) |
69.55 |
 Monaco Monaco |
70.17 |
 United Arab Emirates United Arab Emirates |
73.97 |
 Qatar Qatar |
76.66 |
 Vatican City Vatican City |
100.00 |
Cuba has the lowest migrant share in the dataset at just 0.02%, followed by the Philippines at 0.08%. China and Madagascar each stand at 0.12%.
What Does a Migrant Share Below 1% Look Like?
In practical terms, a migrant share below 1% means that a randomly selected group of 100 residents would typically include fewer than one person born in another country.
Several of these countries have some of the world’s largest populations, including China, India, Indonesia, and Nigeria. Their size helps explain why nearly three-fifths of humanity lives in places where international migrants have a minimal demographic presence.
Japan is frequently viewed as the archetype of a low-immigration society. Yet migrants account for roughly 3% of its population, well above the cutoff for this map. Every country highlighted here has an even smaller foreign-born share.
High-Immigration Countries Are the Exception
The map captures only the lowest end of the spectrum. Another 38 countries and territories have migrant shares between 1% and 3%, bringing the total with shares below 3% to 81.
That picture contrasts sharply with countries such as Canada, Australia, and Switzerland, where migrants account for a substantial share of residents and where foreign-born populations have grown significantly.
International migrants also tend to remain relatively close to home. According to Our World in Data, roughly 47% move less than 500 kilometers (about 300 miles), while most stay on the same continent.
Together, these patterns show that international migration is concentrated in a comparatively small number of destinations, including the countries that host the largest migrant populations today.