How the U.S. Economy Outgrew the UK Over 17 Years
This was originally posted on our Voronoi app. Download the app for free on iOS or Android and discover incredible data-driven charts from a variety of trusted sources.
Key Takeaways
- America has grown substantially since the 2008 crisis, both in stock market valuation (e.g. S&P 500) and in traditional wealth metrics (e.g. wealth per capita)
- The UK has stalled over the same timeframe, with wealth per capita actually shrinking by 10% in U.S. dollar terms
Since the 2008 financial crisis, the economic paths of the U.S. and UK have sharply diverged due to differences in productivity, investment, and currency performance.
To see what this divergence really looks like, we’ve compared the two countries across GDP, stock market, and traditional wealth metrics from 2007 to 2024.
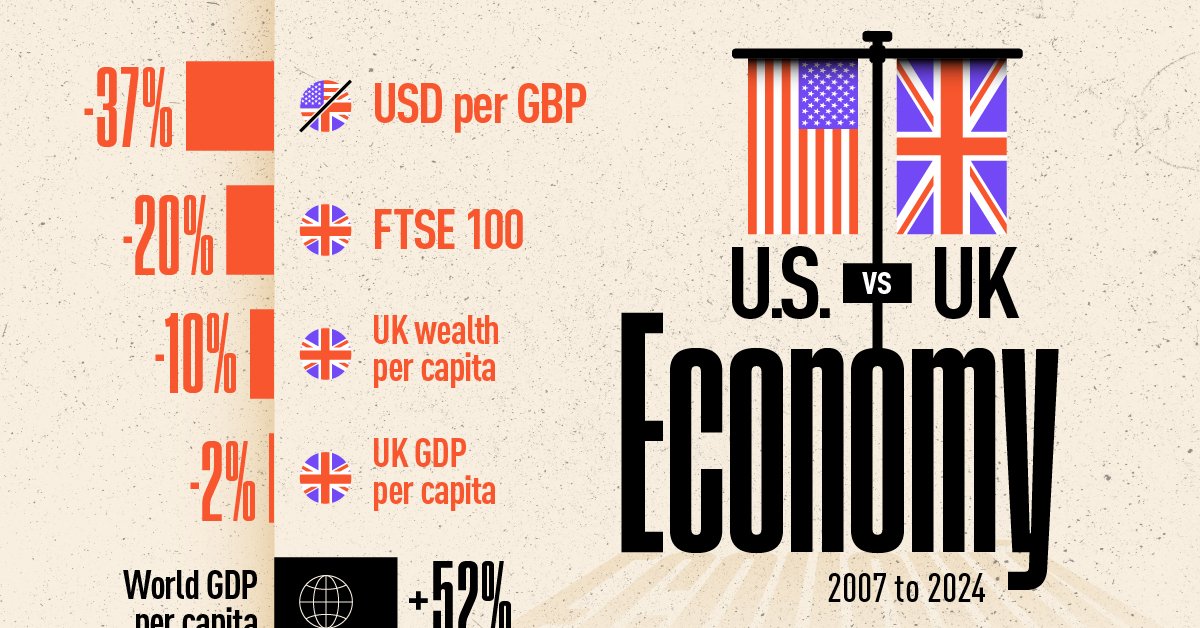
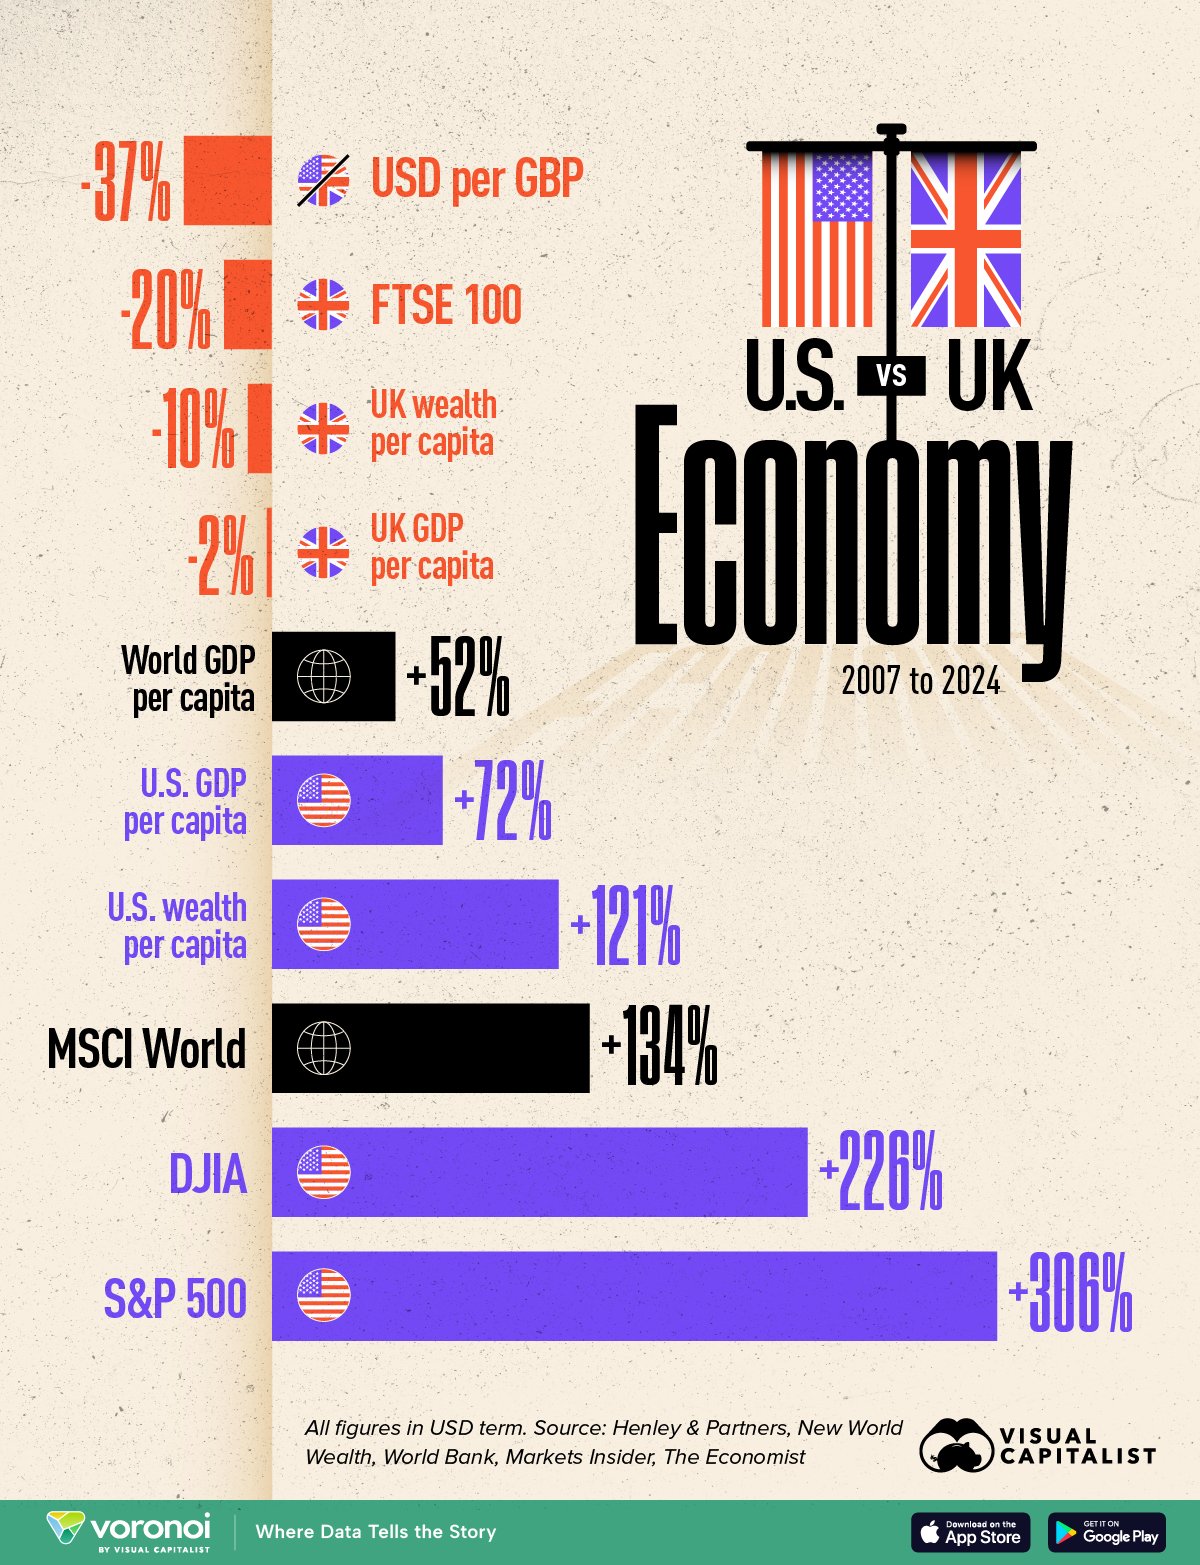
The U.S. vs UK Economy
The data featured in this visualization was compiled by Henley & Partners. Note that all figures are in U.S. dollar terms.
| Index/Metric | Change (2007–2024) |
|---|---|
 S&P 500 S&P 500 |
306% |
| DJIA |
226% |
 MSCI World MSCI World |
134% |
| USA wealth per capita |
121% |
| USA GDP per capita |
72% |
| World GDP per capita |
52% |
 UK GDP per capita UK GDP per capita |
-2% |
| UK wealth per capita |
-10% |
| FTSE 100 |
-20% |
| / USD per GBP |
-37% |
U.S. Market and Wealth Growth Has Been Robust
Over the past 17 years, the U.S. economy has seen major gains across key metrics. The S&P 500 surged 306%, driven by strong corporate profits and the rise of tech giants. Meanwhile, wealth per capita more than doubled, and GDP per capita rose 72%.
According to Henley & Partners, drivers of America’s wealth boom include:
- Florida becoming a top destination for the world’s high net worth individuals (HNWIs)
- Large forex inflows into U.S. stock exchanges (e.g. NYSE), particularly from Latin America, the Middle East, and Africa
- U.S. dominance in high-growth tech sectors such as software, chip design, and AI
UK Economy Faces Long-Term Stagnation
Since the Global Financial Crisis, wealth per capita in the UK has actually decreased by 10%.
Henley & Partners cites the following reasons for the country’s poor performance:
- High capital gains tax and estate duty rates (among the highest globally) deter wealthy individuals from living in the UK.
- Brexit added years of uncertainty, discouraging business investment and weakening trade particularly in the services sector.
- The dwindling importance of the London Stock Exchange, once the world’s largest stock market by market cap, which now ranks 11th globally.
Pound Weakness Amplifies the Gap
Currency depreciation has further widened the gap between the U.S. and UK.
According to this analysis, the British pound has lost 37% of its value against the U.S. dollar since 2007. This not only impacts trade, but also reduces the global purchasing power of UK-based investors and households.
Learn More on the Voronoi App 
If you enjoyed today’s post, check out The G7’S Global Footprint in 2025 on Voronoi, the new app from Visual Capitalist.