

Support CleanTechnica’s work through a Substack subscription, on Patreon, or on Stripe. Help us produce all of the high-quality, original content we publish week after week despite the challenges of content-scraping AI, antisocial media, inflation, and other hurdles.
Hydrogen occupies an unusually large share of the energy-transition information stream for the amount of physical deployment behind it. Fuel-cell trucks, buses, trains, ships, storage projects, demonstrations and records recur through corporate releases, government announcements, trade publications and mainstream reporting, creating the impression that hydrogen remains a substantial parallel pathway to batteries and direct electrification across many sectors. I tested that impression with a bounded register of positive milestones from 2022 through 2025. Batteries actually generated more announcements than hydrogen, 206 versus 114, but that modest 1.8-to-one difference bears little resemblance to the markets underneath them.
The divergence becomes obvious once physical denominators are restored. In freight trucks, the announcement ratio is only about 1.5 to one in favor of batteries, while China had roughly 366,000 electric heavy trucks at the end of 2025 versus about 18,000 fuel-cell heavy trucks. Transit buses show a similar pattern: 47 battery milestones versus 23 hydrogen milestones, yet more than 680,000 electric buses were operating in China alone compared with roughly 15,000 fuel-cell buses globally. Maritime announcements are separated by only about two to one, while DNV’s operating-fleet evidence shows seven hydrogen-fuelled vessels against more than 1,300 battery-equipped vessels.
The full analysis reconstructs the missing denominators, tests commercial maturity and source genealogy, and shows how to tell market formation from a dense stream of announcements. Read it—and subscribe—at TFIE Strategy Briefing.
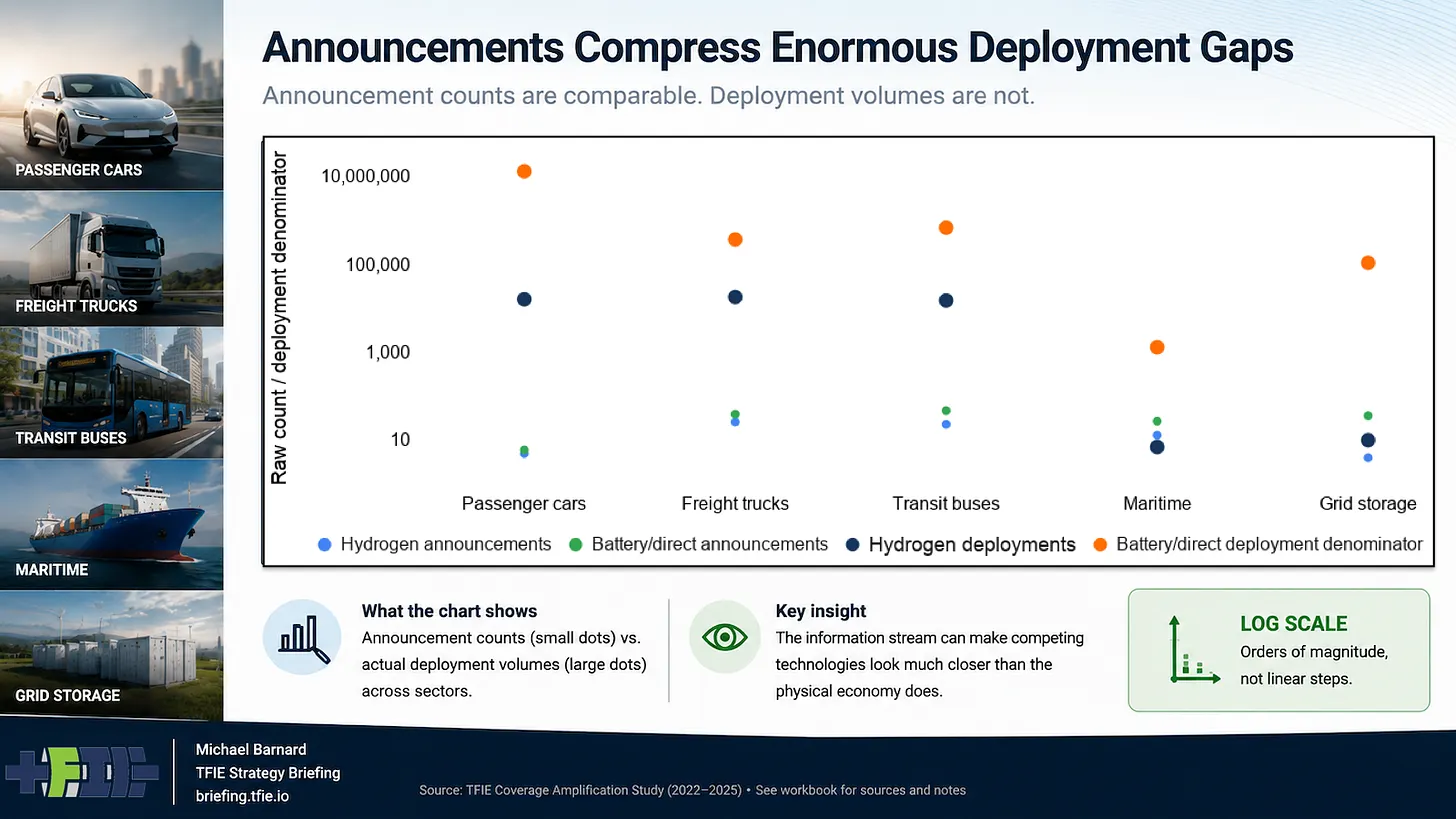
Passenger cars and grid storage make the compression even clearer. The passenger-car extension contains five hydrogen milestone roots and six battery roots, almost parity in the information stream, against roughly 16,000 fuel-cell passenger vehicles and about 13 million battery-electric cars in the 2025 sales denominator. Grid storage is more extreme again. Four genuine hydrogen-storage announcement roots sit beside 36 battery-storage roots, a nine-to-one information difference, while the physical comparison is approximately 10 MW of hydrogen demonstration capacity against about 108,000 MW of battery-storage additions in 2025. That comparison is about power rather than duration or equivalent storage service, but as a measure of market scale it is still roughly 10,800 to one.
None of this requires hydrogen stories to be false or journalists to be uniquely credulous. Most of the events are real. The distortion arises because news is organized around discrete events while markets are not. A ten-bus hydrogen deployment can generate one announcement, and an order for hundreds of battery buses can also generate one announcement. Once a technology becomes routine, much of its growth occurs through purchases and installations that are no longer especially newsworthy. Scarcity can therefore sustain attention: a first hydrogen train in another country, another truck pilot or another maritime demonstrator remains notable precisely because there are relatively few of them.
JCB’s Hydromax record car illustrates the mechanism unusually well. The purpose-built hydrogen-combustion streamliner completed two FIA-observed runs at Bonneville and averaged 406.320 mph. Ground News grouped 127 sources around the resulting record story after an earlier publicity cycle had already produced an 88-source cluster. The achievement was genuine, but its commercial denominator remained one vehicle, no fleet, no customer utilization, no operating economics and no repeat procurement. What multiplied was exposure to the story, not the underlying market evidence.
Commercial maturity adds another layer. In the normalized four-year sample, battery events averaged 5.97 on a seven-stage commercialization ladder compared with 4.40 for hydrogen. About 82% of battery events represented scaled deployment or repeat procurement, versus about 40% of hydrogen events. That does not mean hydrogen projects never become commercial. Transit buses provide a clear counterexample, with repeat hydrogen procurements and real operating experience in several markets. Passenger rail also has genuine operating evidence. The more useful distinction is that successful demonstrations, paid pilots, repeated operation and repeat commercial procurement are different forms of evidence and should not be treated as interchangeable.
So what should analysts, investors and policymakers do when the information stream systematically compresses enormous differences in deployment into similarly sized stories? How should they distinguish genuine market formation from pilots, repeated publicity and technologies that remain commercially marginal despite years of attention?
The full TFIE Strategy Briefing analysis lays out the evidence checks, denominator discipline and follow-up tests that make those distinctions visible.
Sign up for CleanTechnica’s Weekly Substack for Zach and Scott’s in-depth analyses and high level summaries, sign up for our daily newsletter, and follow us on Google News!
Advertisement
Have a tip for CleanTechnica? Want to advertise? Want to suggest a guest for our CleanTech Talk podcast? Contact us here.
Sign up for our daily newsletter for 15 new cleantech stories a day. Or sign up for our weekly one on top stories of the week if daily is too frequent.

[embedded content]

[embedded content]
CleanTechnica uses affiliate links. See our policy here.
CleanTechnica’s Comment Policy


