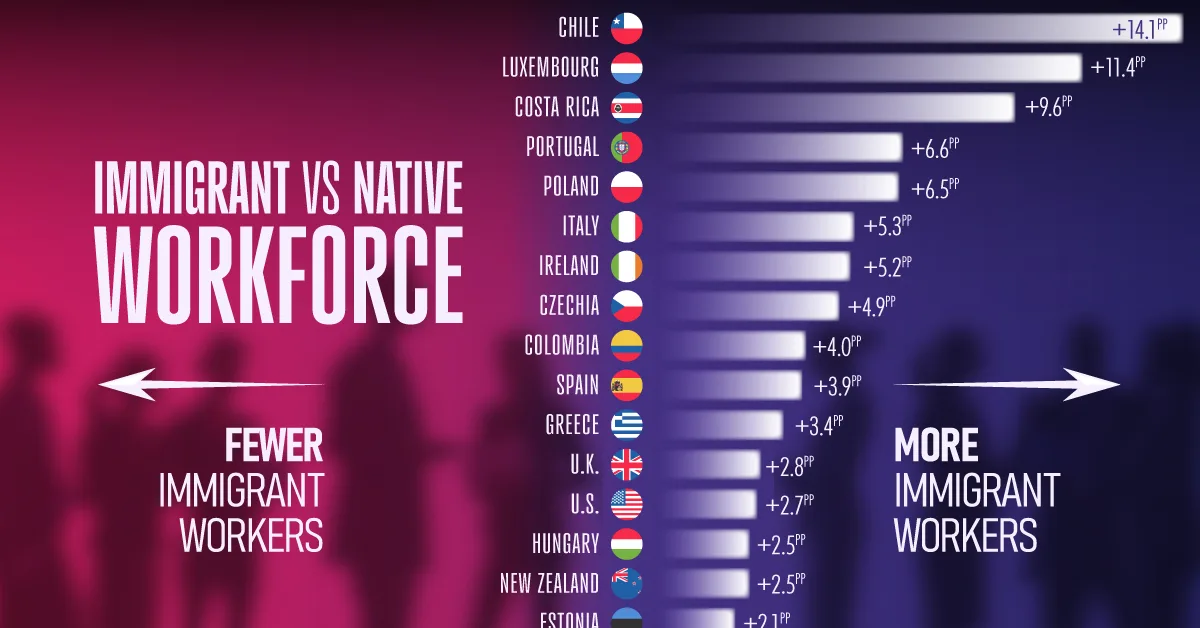
Immigrant vs. Native-Born Labor Force Participation, by Country
See visuals like this from many other data creators on our Voronoi app. Download it for free on iOS or Android and discover incredible data-driven charts from a variety of trusted sources.
Key Takeaways
- Immigrants have higher labor force participation than native-born populations in 21 of 36 OECD countries.
- In Chile, 83% of immigrants are active in the labor market, compared to just 69% of native-born adults.
- In a few countries, including the Netherlands, Türkiye, and Germany, native-born participation remains higher.
As many developed economies face aging populations and shrinking workforces, labor force participation has become increasingly important, and is a key driver behind immigration policy.
This chart compares labor force participation rates between native-born and foreign-born populations across OECD countries, using data from the OECD’s International Migration Outlook 2025. Labor force participation is defined as the share of adults who are either employed or actively seeking work.
Immigrant Participation Often Matches Native-Born Rates
Across OECD countries, the average labor force participation rate for immigrants stands at 77%, slightly higher than the 76% average for native-born adults. In many countries, immigrants are just as engaged in the labor market, if not more, than their native-born counterparts.
The table below shows labor force participation rates for native-born and foreign-born populations across OECD countries:
| Country | Foreign-born participation rate | Native-born participation rate |
|---|---|---|
 Chile Chile |
83.0% | 68.9% |
 Luxembourg Luxembourg |
79.2% | 67.8% |
 Costa Rica Costa Rica |
74.1% | 64.5% |
 Portugal Portugal |
83.6% | 77.0% |
 Poland Poland |
81.1% | 74.6% |
 Ireland Ireland |
81.6% | 76.4% |
 Italy Italy |
71.1% | 65.8% |
 Czechia Czechia |
82.1% | 77.2% |
 Colombia Colombia |
70.6% | 66.6% |
 Spain Spain |
77.6% | 73.7% |
 Greece Greece |
73.6% | 70.2% |
 United Kingdom United Kingdom |
80.4% | 77.6% |
 Hungary Hungary |
81.1% | 78.6% |
 United States United States |
76.0% | 73.3% |
 New Zealand New Zealand |
84.3% | 81.8% |
 Estonia Estonia |
84.0% | 81.9% |
 Iceland Iceland |
90.1% | 88.3% |
 Slovenia Slovenia |
77.4% | 75.7% |
 Japan Japan |
81.4% | 79.8% |
 Canada Canada |
80.6% | 79.4% |
 Denmark Denmark |
83.1% | 82.3% |
 Australia Australia |
80.6% | 80.6% |
 South Korea South Korea |
71.8% | 72.3% |
 Sweden Sweden |
83.5% | 84.0% |
 Slovak Republic Slovak Republic |
75.5% | 76.6% |
 Lithuania Lithuania |
78.4% | 79.5% |
 Latvia Latvia |
75.4% | 76.9% |
 Austria Austria |
76.9% | 78.6% |
 Switzerland Switzerland |
82.5% | 85.0% |
 Finland Finland |
79.9% | 79.7% |
 Belgium Belgium |
68.4% | 71.8% |
 France France |
70.9% | 75.2% |
 Norway Norway |
76.6% | 81.6% |
 Germany Germany |
74.3% | 82.1% |
 Mexico Mexico |
56.4% | 65.8% |
 Netherlands Netherlands |
76.3% | 87.5% |
 Türkiye Türkiye |
49.7% | 60.9% |
 OECD average OECD average |
76.9% | 76.1% |
Chile shows the largest gap favoring immigrants, with a 14.1 percentage-point difference in labor force participation. The country’s foreign-born population has grown by 334% since 2014, driven largely by migration from other South American countries such as Venezuela, Peru, and Colombia.
Luxembourg also stands out, with nearly four in five immigrants (79%) active in the labor market, compared to 68% of native-born adults. It also has one of the world’s highest proportions of international migrants in its population. Costa Rica follows a similar pattern, where immigrant participation reaches 74%, versus 65% for native citizens.
Countries With High Native-Born Participation
While immigrants are more active in many countries, the opposite pattern appears in several large European economies.
In Germany, native-born participation stands at 82%, compared to 74% among immigrants. Although Germany faces labor shortages and has expanded pathways for skilled immigration, around 24% of long-term arrivals are humanitarian migrants, many of whom are not immediately integrated into the labor market.
The Netherlands and Türkiye show the largest gaps, with native-born labor force participation exceeding immigrant participation by 11.2 percentage points in both countries.
Learn More on the Voronoi App 
If you enjoyed this post, see How Much of Europe is Made of Immigrants? on Voronoi.
- Source: https://www.visualcapitalist.com/immigrant-vs-native-born-labor-force-participation-by-country/