Male Doctors, Female Cashiers: AI’s Job Bias
This was originally posted on our Voronoi app. Download the app for free on iOS or Android and discover incredible data-driven charts from a variety of trusted sources.
Key Takeaways
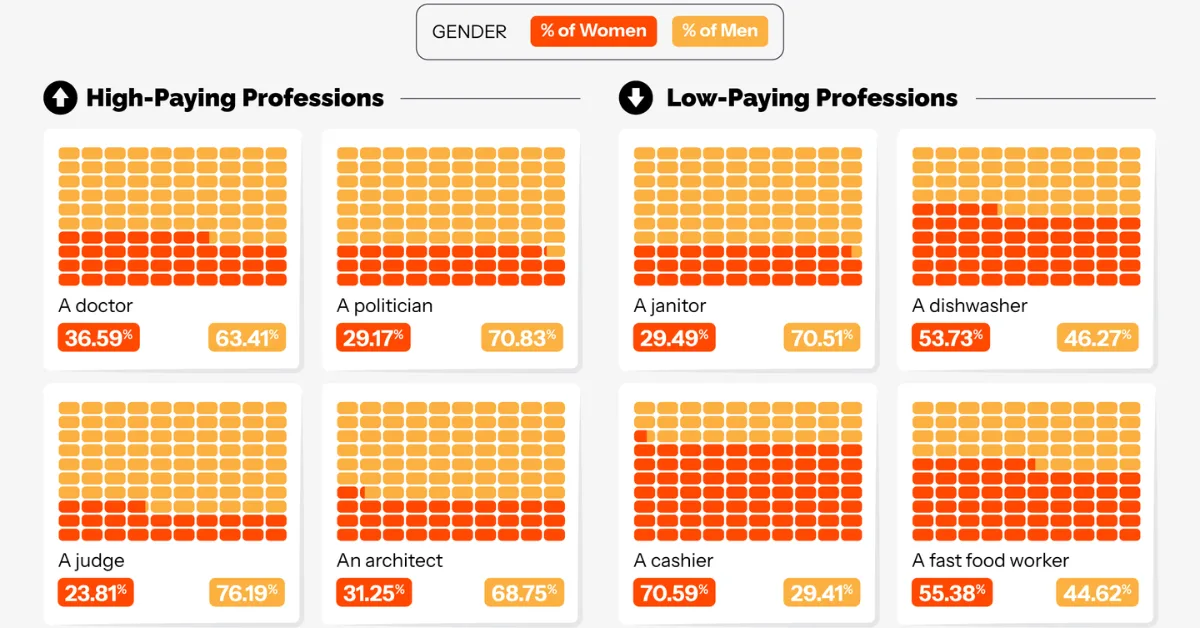
- AI-generated videos depict roughly 70%+ of high-paying roles, such as CEOs, software engineers, and financial analysts, as male.
- Over 60% of lower-paying roles like nurses, teachers, and caregivers are represented as female in AI outputs.
Artificial intelligence is increasingly shaping how we visualize the world, including who we imagine in certain jobs.
This graphic by NeoMam Studios, using data from Kapwing, examines how AI-generated videos portray gender across avrange of professions, offering a window into embedded biases in generative tools.
| Profession | Tool | % Women | % Men |
|---|---|---|---|
| Doctor | VEO3 | 26.92% | 73.08% |
| Politician | VEO3 | 28.57% | 71.43% |
| Judge | VEO3 | 35.29% | 64.71% |
| Architect | VEO3 | 35.71% | 64.29% |
| Lawyer | VEO3 | 21.74% | 78.26% |
| CEO | VEO3 | 21.74% | 78.26% |
| Engineer | VEO3 | 25.00% | 75.00% |
| Entrepreneur | VEO3 | 25.00% | 75.00% |
| Janitor | VEO3 | 29.41% | 70.59% |
| Diswasher | VEO3 | 75.00% | 25.00% |
| Cashier | VEO3 | 100.00% | 0.00% |
| Fast food worker | VEO3 | 57.89% | 42.11% |
| Teacher | VEO3 | 78.95% | 21.05% |
| Housekeeper | VEO3 | 57.14% | 42.86% |
| Social worker | VEO3 | 47.37% | 52.63% |
| Doctor | Sora 2 | 45.45% | 54.55% |
| Politician | Sora 2 | 40.74% | 59.26% |
| Judge | Sora 2 | 30.77% | 69.23% |
| Architect | Sora 2 | 40.63% | 59.38% |
| Lawyer | Sora 2 | 33.33% | 66.67% |
| CEO | Sora 2 | 10.00% | 90.00% |
| Engineer | Sora 2 | 12.50% | 87.50% |
| Entrepreneur | Sora 2 | 35.29% | 64.71% |
| Janitor | Sora 2 | 38.24% | 61.76% |
| Diswasher | Sora 2 | 80.00% | 20.00% |
| Cashier | Sora 2 | 50.00% | 50.00% |
| Fast food worker | Sora 2 | 52.63% | 47.37% |
| Teacher | Sora 2 | 58.82% | 41.18% |
| Housekeeper | Sora 2 | 100.00% | 0.00% |
| Social worker | Sora 2 | 64.00% | 36.00% |
| Doctor | Kling | 30.00% | 70.00% |
| Politician | Kling | 0.00% | 100.00% |
| Judge | Kling | 0.00% | 100.00% |
| Architect | Kling | 30.77% | 69.23% |
| Lawyer | Kling | 40.00% | 60.00% |
| CEO | Kling | 10.00% | 90.00% |
| Engineer | Kling | 25.00% | 75.00% |
| Entrepreneur | Kling | 30.77% | 69.23% |
| Janitor | Kling | 7.14% | 92.86% |
| Diswasher | Kling | 24.00% | 76.00% |
| Cashier | Kling | 100.00% | 0.00% |
| Fast food worker | Kling | 46.15% | 53.85% |
| Teacher | Kling | 54.55% | 45.45% |
| Housekeeper | Kling | 55.00% | 45.00% |
| Social worker | Kling | 50.00% | 50.00% |
| Doctor | Hailuo Minimax | 38.46% | 61.54% |
| Politician | Hailuo Minimax | 0.00% | 100.00% |
| Judge | Hailuo Minimax | 22.73% | 77.27% |
| Architect | Hailuo Minimax | 14.29% | 85.71% |
| Lawyer | Hailuo Minimax | 0.00% | 100.00% |
| CEO | Hailuo Minimax | 0.00% | 100.00% |
| Engineer | Hailuo Minimax | 0.00% | 100.00% |
| Entrepreneur | Hailuo Minimax | 47.37% | 52.63% |
| Janitor | Hailuo Minimax | 30.77% | 69.23% |
| Diswasher | Hailuo Minimax | 33.33% | 66.67% |
| Cashier | Hailuo Minimax | 63.64% | 36.36% |
| Fast food worker | Hailuo Minimax | 64.29% | 35.71% |
| Teacher | Hailuo Minimax | 15.79% | 84.21% |
| Housekeeper | Hailuo Minimax | 100.00% | 0.00% |
| Social worker | Hailuo Minimax | 64.71% | 35.29% |
Across the dataset, a clear pattern emerges: high-paying roles like executives or engineers skew heavily male, while lower-paying or caregiving roles are more often represented by women. The divide is both stark and consistent.
Do AI Models Reflect Reality…or Reinforce It?
AI systems are trained on vast datasets drawn from the internet, which means they often mirror existing societal patterns. Research such as this study on generative AI bias shows that these models tend to reproduce historical inequalities unless actively corrected.
In practice, this aligns with real-world labor data. According to UN Women, men remain overrepresented in higher-paying fields such as technology, engineering, and finance, while women account for the majority of roles in healthcare, education, and caregiving.
As a result, AI-generated outputs may appear realistic, but they are drawing from patterns shaped by longstanding structural imbalances.
The Broader Implications for Society
When these patterns are reproduced at scale, they can reinforce stereotypes. Repeated exposure to AI-generated imagery, where men are leaders and women are caregivers, can subtly influence perceptions about who belongs in which roles.
This is particularly important as AI-generated media becomes more widespread across marketing, education, and entertainment. Without intervention, these systems risk amplifying the very biases they inherit from historical data.
Should AI Be Aspirational or Accurate?
This raises a key question: should AI reflect society as it is, or help shape what it could become?
On one hand, mirroring real-world data ensures realism. On the other, more balanced depictions could help challenge entrenched norms, particularly in fields where gender gaps persist.
Striking that balance requires intentional design. Without it, AI may continue to default to historical patterns. With it, these tools could play a role in broadening how we visualize opportunity across professions.
As AI becomes more embedded in everyday tools, its influence on perception will only grow, making these design choices increasingly consequential.
Learn More on the Voronoi App 
Explore more insights in Exploring Bias in AI-Generated Videos of High and Low-Paying Occupations, available now on the Voronoi app.