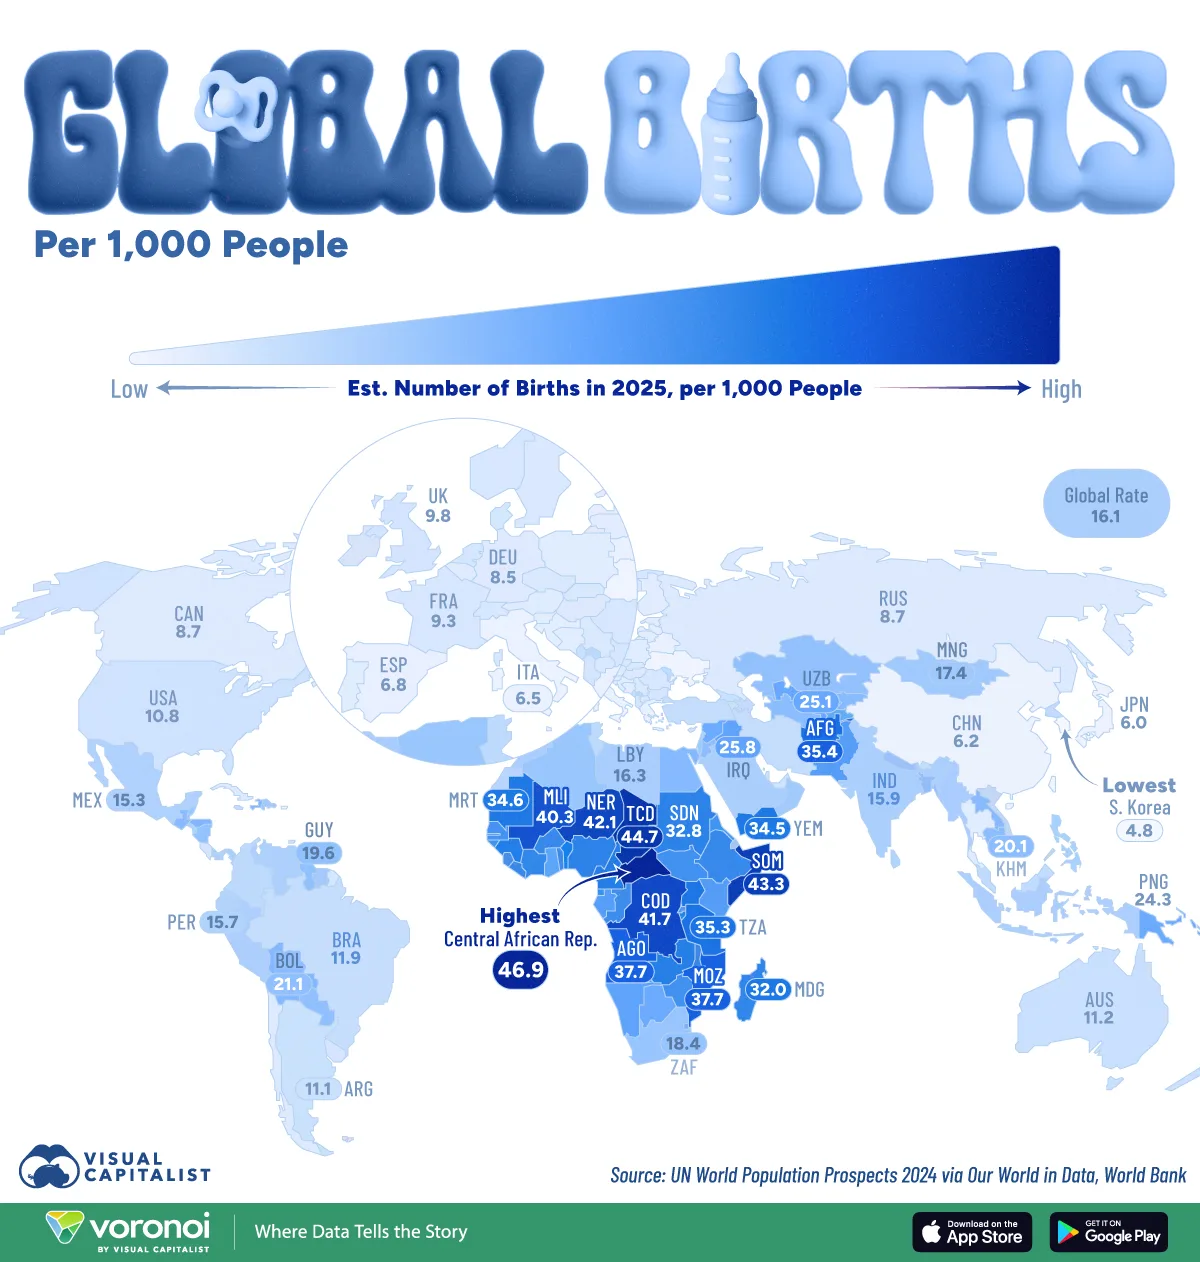
Mapped: Birth Rates Around the World in 2025
See visuals like this from many other data creators on our Voronoi app. Download it for free on iOS or Android and discover incredible data-driven charts from a variety of trusted sources.
Key Takeaways
- The global birth rate has projected at 16.1 births per 1,000 people in 2025, continuing a decades-long decline.
- Several Sub-Saharan African countries still record rates above 40 per 1,000, among the highest in the world.
- Many advanced economies now have birth rates below 10 per 1,000, fueling concerns about aging populations and shrinking workforces.
Birth rates are falling across much of the world—but not everywhere.
According to the UN World Population Prospects 2024, the global birth rate in 2025 was projected at 16.1 births per 1,000 people. Yet this average masks a stark demographic divide: while much of Europe and East Asia faces record-low fertility, parts of Sub-Saharan Africa continue to record some of the highest birth rates globally.
This widening gap is reshaping economies, labor markets, and long-term growth prospects. Countries with persistently low birth rates are grappling with aging populations and rising dependency ratios, while higher-growth regions face different pressures tied to rapid population expansion.
Where Birth Rates Are Highest
Countries with the highest birth rates are overwhelmingly concentrated in Sub-Saharan Africa, alongside a few countries in the Middle East and Asia.
The table below shows the projected crude birth rates by country:
| Rank | Country | Crude birth rate (births per 1,000 people) |
|---|---|---|
| 1 |  Central African Republic Central African Republic |
46.9 |
| 2 |  Chad Chad |
44.7 |
| 3 |  Somalia Somalia |
43.3 |
| 4 |  Niger Niger |
42.1 |
| 5 |  Democratic Republic of Congo Democratic Republic of Congo |
41.7 |
| 6 |  Mali Mali |
40.3 |
| 7 |  Angola Angola |
37.7 |
| 8 |  Mozambique Mozambique |
37.7 |
| 9 |  Afghanistan Afghanistan |
35.4 |
| 10 |  Tanzania Tanzania |
35.3 |
| 11 |  Uganda Uganda |
34.7 |
| 12 |  Mauritania Mauritania |
34.6 |
| 13 |  Yemen Yemen |
34.5 |
| 14 |  Benin Benin |
33.9 |
| 15 |  Cameroon Cameroon |
33.7 |
| 16 |  Guinea Guinea |
33.5 |
| 17 |  Burundi Burundi |
33.4 |
| 18 |  Zambia Zambia |
33.3 |
| 19 |  Nigeria Nigeria |
32.8 |
| 20 |  Sudan Sudan |
32.8 |
| 21 |  Madagascar Madagascar |
32.0 |
| 22 |  Côte d’Ivoire Côte d’Ivoire |
31.9 |
| 23 |  Malawi Malawi |
31.6 |
| 24 |  Ethiopia Ethiopia |
31.6 |
| 25 |  Burkina Faso Burkina Faso |
31.5 |
| 26 |  Togo Togo |
31.1 |
| 27 |  Liberia Liberia |
30.9 |
| 28 |  Congo Congo |
30.9 |
| 29 |  Equatorial Guinea Equatorial Guinea |
30.3 |
| 30 |  Sierra Leone Sierra Leone |
30.1 |
| 31 |  Zimbabwe Zimbabwe |
30.1 |
| 32 |  South Sudan South Sudan |
30.0 |
| 33 |  Gambia Gambia |
29.9 |
| 34 |  Guinea-Bissau Guinea-Bissau |
29.7 |
| 35 |  Senegal Senegal |
29.6 |
| 36 |  Eritrea Eritrea |
29.2 |
| 37 |  São Tomé and Príncipe São Tomé and Príncipe |
28.4 |
| 38 |  Rwanda Rwanda |
28.3 |
| 39 |  Comoros Comoros |
28.3 |
| 40 |  Vanuatu Vanuatu |
27.8 |
| 41 |  Pakistan Pakistan |
27.5 |
| 42 |  Palestine Palestine |
27.4 |
| 43 |  Kenya Kenya |
27.3 |
| 44 |  Gabon Gabon |
27.2 |
| 45 |  Solomon Islands Solomon Islands |
27.1 |
| 46 |  Ghana Ghana |
26.1 |
| 47 |  Namibia Namibia |
26.0 |
| 48 |  Iraq Iraq |
25.8 |
| 49 |  Kiribati Kiribati |
25.2 |
| 50 |  Uzbekistan Uzbekistan |
25.1 |
| 51 |  Tajikistan Tajikistan |
25.0 |
| 52 |  Samoa Samoa |
24.8 |
| 53 |  Syria Syria |
24.4 |
| 54 |  Papua New Guinea Papua New Guinea |
24.3 |
| 55 |  Botswana Botswana |
24.3 |
| 56 |  Nauru Nauru |
24.2 |
| 57 |  Lesotho Lesotho |
23.7 |
| 58 |  Eswatini Eswatini |
23.5 |
| 59 |  Tonga Tonga |
22.7 |
| 60 |  Micronesia Micronesia |
22.2 |
| 61 |  Timor-Leste Timor-Leste |
21.9 |
| 62 |  Haiti Haiti |
21.9 |
| 63 |  Honduras Honduras |
21.7 |
| 64 |  Bolivia Bolivia |
21.1 |
| 65 |  Egypt Egypt |
21.0 |
| 66 |  Djibouti Djibouti |
20.9 |
| 67 |  Tuvalu Tuvalu |
20.8 |
| 68 |  Laos Laos |
20.8 |
| 69 |  Kyrgyzstan Kyrgyzstan |
20.7 |
| 70 |  Guatemala Guatemala |
20.7 |
| 71 |  Turkmenistan Turkmenistan |
20.4 |
| 72 |  Cambodia Cambodia |
20.1 |
| 73 |  Jordan Jordan |
20.1 |
| 74 |  Bangladesh Bangladesh |
19.8 |
| 75 |  Guyana Guyana |
19.6 |
| 76 |  Paraguay Paraguay |
19.6 |
| 77 |  Kazakhstan Kazakhstan |
19.2 |
| 78 |  Nicaragua Nicaragua |
19.1 |
| 79 |  Marshall Islands Marshall Islands |
19.0 |
| 80 |  Nepal Nepal |
18.6 |
| 81 |  South Africa South Africa |
18.4 |
| 82 |  Algeria Algeria |
18.3 |
| 83 |  Belize Belize |
18.0 |
| 84 |  Fiji Fiji |
17.7 |
| 85 |  Mongolia Mongolia |
17.4 |
| 86 |  Dominican Republic Dominican Republic |
17.4 |
| 87 |  Israel Israel |
17.2 |
| 88 |  Suriname Suriname |
17.1 |
| 89 |  Oman Oman |
17.1 |
| 90 |  Myanmar Myanmar |
16.3 |
| 91 |  Libya Libya |
16.3 |
| 92 |  Morocco Morocco |
16.3 |
| 93 |  Saudi Arabia Saudi Arabia |
16.0 |
| 94 |  Lebanon Lebanon |
15.9 |
| 95 |  Philippines Philippines |
15.9 |
| 96 |  India India |
15.9 |
| 97 |  Panama Panama |
15.9 |
| 98 |  Indonesia Indonesia |
15.7 |
| 99 |  Peru Peru |
15.7 |
| 100 |  El Salvador El Salvador |
15.4 |
| 101 |  Venezuela Venezuela |
15.4 |
| 102 |  Mexico Mexico |
15.3 |
| 103 |  Ecuador Ecuador |
14.8 |
| 104 |  Seychelles Seychelles |
14.6 |
| 105 |  Sri Lanka Sri Lanka |
14.5 |
| 106 |  Western Sahara Western Sahara |
14.0 |
| 107 |  New Caledonia New Caledonia |
13.9 |
| 108 |  Vietnam Vietnam |
13.2 |
| 109 |  Brunei Brunei |
13.1 |
| 110 |  Colombia Colombia |
13.1 |
| 111 |  Tunisia Tunisia |
13.1 |
| 112 |  Greenland Greenland |
13.0 |
| 113 |  Moldova Moldova |
13.0 |
| 114 |  Kosovo Kosovo |
12.8 |
| 115 |  North Korea North Korea |
12.6 |
| 116 |  Bhutan Bhutan |
12.4 |
| 117 |  Malaysia Malaysia |
12.4 |
| 118 |  Bahrain Bahrain |
12.3 |
| 119 |  Turkey Turkey |
12.3 |
| 120 |  Iran Iran |
12.3 |
| 121 |  Cape Verde Cape Verde |
12.1 |
| 122 |  Brazil Brazil |
11.9 |
| 123 |  Azerbaijan Azerbaijan |
11.8 |
| 124 |  Saint Vincent and the Grenadines Saint Vincent and the Grenadines |
11.7 |
| 125 |  Antigua and Barbuda Antigua and Barbuda |
11.6 |
| 126 |  Armenia Armenia |
11.5 |
| 127 |  Saint Kitts and Nevis Saint Kitts and Nevis |
11.5 |
| 128 |  Georgia Georgia |
11.5 |
| 129 |  Trinidad and Tobago Trinidad and Tobago |
11.4 |
| 130 |  Grenada Grenada |
11.3 |
| 131 |  Jamaica Jamaica |
11.2 |
| 132 |  Australia Australia |
11.2 |
| 133 |  Montenegro Montenegro |
11.2 |
| 134 |  Argentina Argentina |
11.1 |
| 135 |  Barbados Barbados |
11.0 |
| 136 |  Saint Lucia Saint Lucia |
11.0 |
| 137 |  New Zealand New Zealand |
11.0 |
| 138 |  Iceland Iceland |
10.8 |
| 139 |  United States United States |
10.8 |
| 140 |  Dominica Dominica |
10.8 |
| 141 |  Bahamas Bahamas |
10.7 |
| 142 |  Palau Palau |
10.5 |
| 143 |  United Arab Emirates United Arab Emirates |
10.5 |
| 144 |  Qatar Qatar |
10.5 |
| 145 |  Cyprus Cyprus |
10.3 |
| 146 |  Luxembourg Luxembourg |
10.3 |
| 147 |  Maldives Maldives |
10.2 |
| 148 |  Albania Albania |
10.1 |
| 149 |  Denmark Denmark |
9.9 |
| 150 |  Costa Rica Costa Rica |
9.9 |
| 151 |  United Kingdom United Kingdom |
9.8 |
| 152 |  Kuwait Kuwait |
9.8 |
| 153 |  Ireland Ireland |
9.8 |
| 154 |  Uruguay Uruguay |
9.7 |
| 155 |  Netherlands Netherlands |
9.7 |
| 156 |  Monaco Monaco |
9.6 |
| 157 |  Norway Norway |
9.5 |
| 158 |  Bulgaria Bulgaria |
9.4 |
| 159 |  Romania Romania |
9.4 |
| 160 |  France France |
9.3 |
| 161 |  Liechtenstein Liechtenstein |
9.2 |
| 162 |  Sweden Sweden |
9.2 |
| 163 |  Slovakia Slovakia |
9.2 |
| 164 |  North Macedonia North Macedonia |
9.1 |
| 165 |  Mauritius Mauritius |
9.1 |
| 166 |  Switzerland Switzerland |
9.1 |
| 167 |  Serbia Serbia |
8.8 |
| 168 |  Hungary Hungary |
8.8 |
| 169 |  Canada Canada |
8.7 |
| 170 |  Russia Russia |
8.7 |
| 171 |  Chile Chile |
8.6 |
| 172 |  Belgium Belgium |
8.5 |
| 173 |  Cuba Cuba |
8.5 |
| 174 |  Germany Germany |
8.5 |
| 175 |  Singapore Singapore |
8.3 |
| 176 |  Austria Austria |
8.2 |
| 177 |  Poland Poland |
8.1 |
| 178 |  Slovenia Slovenia |
8.1 |
| 179 |  Croatia Croatia |
8.0 |
| 180 |  Portugal Portugal |
8.0 |
| 181 |  Czechia Czechia |
8.0 |
| 182 |  Thailand Thailand |
8.0 |
| 183 |  Finland Finland |
7.8 |
| 184 |  Estonia Estonia |
7.7 |
| 185 |  Bosnia and Herzegovina Bosnia and Herzegovina |
7.7 |
| 186 |  Lithuania Lithuania |
7.7 |
| 187 |  Malta Malta |
7.4 |
| 188 |  Latvia Latvia |
7.4 |
| 189 |  Andorra Andorra |
6.9 |
| 190 |  Belarus Belarus |
6.8 |
| 191 |  Spain Spain |
6.8 |
| 192 |  Greece Greece |
6.6 |
| 193 |  Italy Italy |
6.5 |
| 194 |  China China |
6.2 |
| 195 |  Japan Japan |
6.0 |
| 196 |  Puerto Rico Puerto Rico |
6.0 |
| 197 |  Ukraine Ukraine |
5.8 |
| 198 |  San Marino San Marino |
5.7 |
| 199 |  Taiwan Taiwan |
5.4 |
| 200 |  South Korea South Korea |
4.8 |
 World World |
16.1 |
The gap between the highest- and lowest-birth-rate countries exceeds 40 births per 1,000 people.
The Central African Republic leads birth rates globally, with nearly 47 births per 1,000 people, followed closely by Chad, Somalia, Niger, and the Democratic Republic of Congo. In these countries, large family sizes are common, and populations tend to be younger, with a high share of women in childbearing age.
High birth rates are also prevalent in parts of the Middle East and South Asia, including Afghanistan, Yemen, and Pakistan, where fertility remains elevated despite gradual declines over time.
Meanwhile, India and China continue to lead in the total number of births worldwide, although their birth rates are relatively lower.
Low Birth Rates in Advanced Economies
At the other end of the spectrum, many developed economies now have birth rates well below the global average.
Countries such as South Korea, Taiwan, Japan, Italy, and Spain record fewer than 7 births per 1,000 people, reflecting delayed family formation, high housing costs, and changing social norms. Several European countries, including Italy, Germany, Switzerland, and Austria, also fall into this low-birth-rate group.
Some of these countries are also among the world’s super-aged societies, where more than 20% of the population are aged over 65 years.
Why Birth Rates Matter
When birth rates remain below the replacement level (2.1 births per woman) for extended periods, countries face shrinking workforces, rising dependency ratios, and mounting pressure on social security and healthcare systems. Over time, populations begin to shrink and age, creating long-term economic challenges.
In contrast, very high birth rates can strain education, infrastructure, and job creation if economic growth does not keep pace.
As a result, governments across the world are increasingly focused on addressing population challenges and demographic policy, whether through family incentives, childcare support, or immigration.
Learn More on the Voronoi App 
If you found this infographic interesting, explore more population and demographic insights on Voronoi, including The World’s Population as 1000 People.


