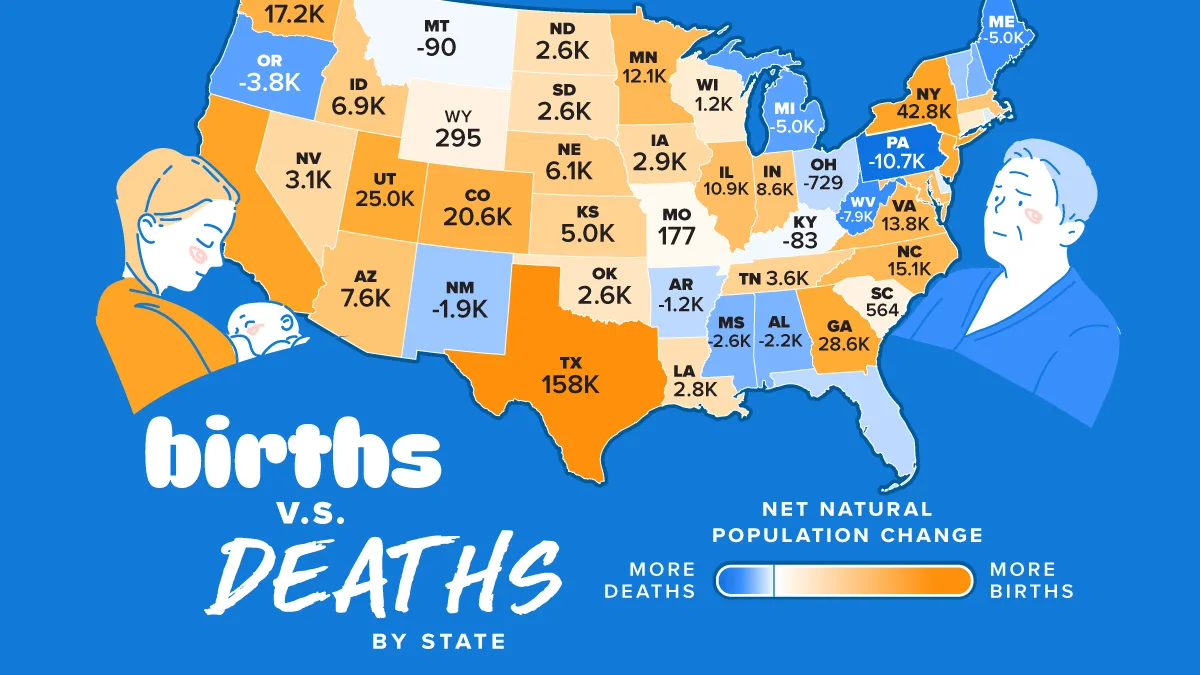
Mapped: Deaths Now Outnumber Births in 17 U.S. States
See visuals like this from many other data creators on our Voronoi app. Download it for free on iOS or Android and discover incredible data-driven charts from a variety of trusted sources.
Key Takeaways
- The number of states recording more deaths than births has more than quadrupled from much of the 2010s.
- Natural population change excludes migration, revealing where births alone no longer sustain population growth.
- Texas, California, New York, Georgia, and Utah recorded the largest natural population gains.
Natural population growth is slowing across much of America.
According to the latest U.S. Census Bureau estimates, 17 states recorded more deaths than births between July 2024 and July 2025, up from only four states during much of the 2010s.
Using U.S. Census Bureau data, this map shows natural population change in every state. Because the measure excludes domestic and international migration, it highlights where population growth increasingly depends on people moving in.
Natural Population Change by State
The table below ranks every state by natural population change between July 2024 and July 2025, highlighting where births continued to outpace deaths—and where they no longer did.
| State | Natural Population Change Jul 2024–Jul 2025 |
|---|---|
| Pennsylvania | -10,708 |
| West Virginia | -7,887 |
| Maine | -5,019 |
| Michigan | -4,998 |
| Oregon | -3,764 |
| Mississippi | -2,607 |
| Alabama | -2,188 |
| New Hampshire | -2,167 |
| New Mexico | -1,885 |
| Vermont | -1,769 |
| Florida | -1,333 |
| Arkansas | -1,224 |
| Ohio | -729 |
| Delaware | -554 |
| Rhode Island | -304 |
| Montana | -90 |
| Kentucky | -83 |
| Missouri | 177 |
| Wyoming | 295 |
| South Carolina | 564 |
| Wisconsin | 1,161 |
| Hawaii | 2,024 |
| Connecticut | 2,283 |
| District of Columbia | 2,516 |
| Oklahoma | 2,559 |
| South Dakota | 2,605 |
| North Dakota | 2,630 |
| Louisiana | 2,774 |
| Iowa | 2,949 |
| Nevada | 3,051 |
| Alaska | 3,308 |
| Tennessee | 3,597 |
| Kansas | 4,951 |
| Nebraska | 6,136 |
| Idaho | 6,900 |
| Massachusetts | 8,419 |
| Indiana | 8,561 |
| Illinois | 10,903 |
| Maryland | 11,444 |
| Minnesota | 12,071 |
| Virginia | 13,817 |
| North Carolina | 15,129 |
| Washington | 17,230 |
| Colorado | 20,608 |
| Utah | 24,961 |
| New Jersey | 26,023 |
| Georgia | 28,631 |
| Arizona | 20,914 |
| New York | 42,815 |
| California | 109,715 |
| Texas | 157,711 |
Pennsylvania recorded the nation’s largest natural decline (-10.7K), followed by West Virginia, Maine, and Michigan. Most states with natural decreases were concentrated in the Northeast and Appalachia, regions that include several states with some of the country’s oldest populations.
Florida also recorded more deaths than births, yet remained one of America’s fastest-growing states because of migration.
The South remained the engine of natural population growth. Texas (+158K), Georgia (+29K), and North Carolina (+15K) posted strong gains. California (+110K) and New York (+43K) also recorded far more births than deaths despite slower overall population growth.
America’s Population Is Increasingly Shaped by Migration
Natural population change tells only part of the story.
Several states with more deaths than births, including Florida, Maine, and Pennsylvania, can still grow overall when migration offsets their natural decline. Others continue losing population even after attracting newcomers.
Meanwhile, states such as Texas, North Carolina, and Arizona benefit from both natural population growth and migration, helping drive some of the country’s fastest population gains.
As America’s population ages and birth rates remain historically low, natural population growth is becoming less common. For a growing number of states, migration—not births—is now the primary driver of population growth, making migration trends increasingly important to their long-term demographic outlook.
Learn More on the Voronoi App 
To learn more about this topic, check out this graphic on immigration’s role in U.S. population growth by state.