How Much Gas Prices Have Risen Since the Iran War
Key Takeaways
- U.S. gas prices have risen about 44% from their pre-war baseline, adding an average of $1.25 per gallon.
- The largest percentage increases are concentrated across the Midwest and Mountain West, with several states up more than 60%.
- States that were already among the most expensive for gas have generally seen smaller percentage increases.
Gas prices have climbed sharply across the U.S. following the outbreak of the Iran War, but the size of the increase varies significantly by state.
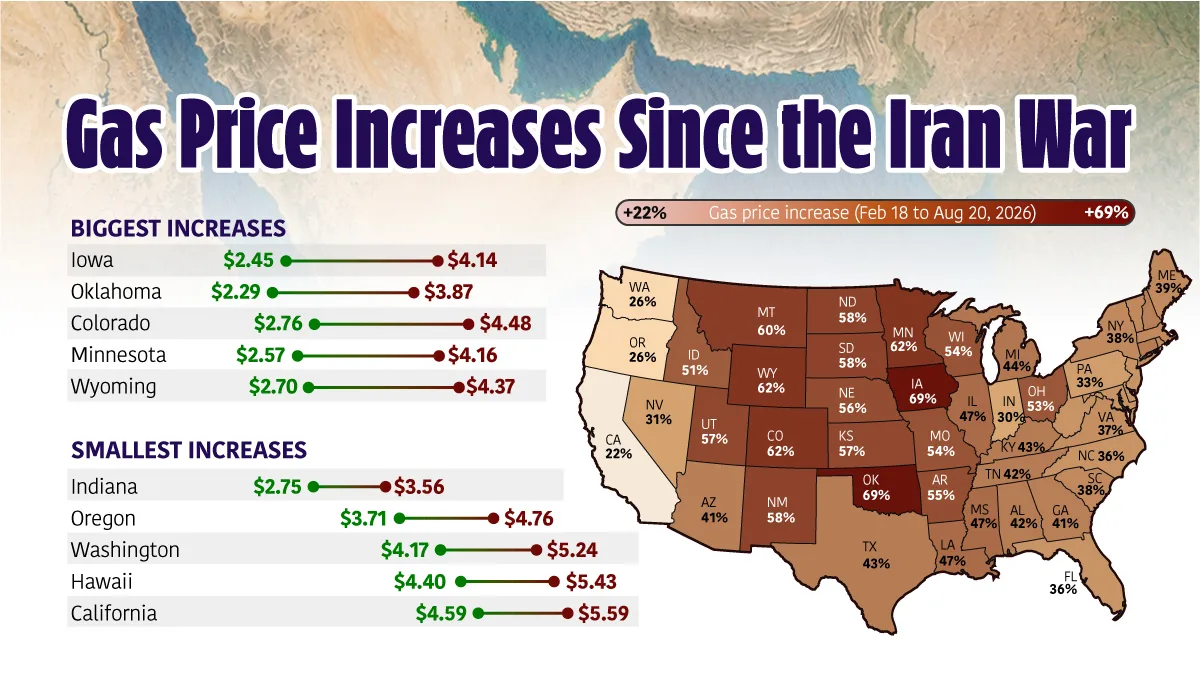
Using AAA price data from February 18, 2026, as a pre-war baseline and prices as of August 20, 2026, this visualization maps the percentage increase across all 50 states and Washington, D.C.
Which States Saw the Biggest Gas Price Increases
Iowa has seen the largest percentage increase in the country, with gas prices jumping 69.1% from $2.45 to $4.14 per gallon. Oklahoma follows closely at 68.8%, while Colorado, Minnesota, and Wyoming have each seen increases of more than 60%.
Montana, New Mexico, North Dakota, South Dakota, and Kansas round out the top 10, each up more than 57%.
The table below shows the full breakdown of price changes by state, sorted from largest to smallest percentage change.
| State | Pre-War Price (Feb 18 2026) |
Current Price (Aug 20 2026) |
$ Change | % Change |
|---|---|---|---|---|
| Iowa | $2.45 | $4.14 | $1.69 | 69.1% |
| Oklahoma | $2.29 | $3.87 | $1.58 | 68.8% |
| Colorado | $2.76 | $4.48 | $1.72 | 62.2% |
| Minnesota | $2.57 | $4.16 | $1.59 | 61.8% |
| Wyoming | $2.70 | $4.37 | $1.67 | 61.8% |
| Montana | $2.75 | $4.39 | $1.64 | 59.7% |
| New Mexico | $2.61 | $4.14 | $1.53 | 58.5% |
| North Dakota | $2.54 | $4.01 | $1.47 | 57.7% |
| South Dakota | $2.59 | $4.08 | $1.49 | 57.7% |
| Kansas | $2.47 | $3.88 | $1.41 | 57.1% |
| Utah | $2.79 | $4.38 | $1.59 | 57.0% |
| Nebraska | $2.59 | $4.04 | $1.45 | 56.1% |
| Arkansas | $2.46 | $3.80 | $1.34 | 54.6% |
| Wisconsin | $2.55 | $3.94 | $1.39 | 54.4% |
| Missouri | $2.52 | $3.89 | $1.37 | 54.3% |
| Ohio | $2.70 | $4.12 | $1.42 | 52.6% |
| Idaho | $2.97 | $4.49 | $1.52 | 51.3% |
| Mississippi | $2.49 | $3.66 | $1.17 | 47.2% |
| Illinois | $2.99 | $4.40 | $1.41 | 47.1% |
| Louisiana | $2.51 | $3.69 | $1.18 | 47.0% |
| Michigan | $2.92 | $4.21 | $1.29 | 44.0% |
| Kentucky | $2.59 | $3.70 | $1.11 | 43.0% |
| Texas | $2.55 | $3.64 | $1.09 | 42.8% |
| Alabama | $2.63 | $3.74 | $1.11 | 42.2% |
| Tennessee | $2.58 | $3.66 | $1.08 | 41.9% |
| Connecticut | $2.90 | $4.10 | $1.20 | 41.5% |
| Arizona | $3.16 | $4.47 | $1.31 | 41.4% |
| Georgia | $2.71 | $3.82 | $1.11 | 41.1% |
| New Hampshire | $2.85 | $4.01 | $1.16 | 40.6% |
| Massachusetts | $2.90 | $4.04 | $1.14 | 39.4% |
| Rhode Island | $2.87 | $4.00 | $1.13 | 39.2% |
| Maine | $2.92 | $4.06 | $1.14 | 39.1% |
| New York | $3.00 | $4.15 | $1.15 | 38.3% |
| Alaska | $3.50 | $4.83 | $1.33 | 38.1% |
| South Carolina | $2.67 | $3.68 | $1.01 | 38.0% |
| Vermont | $3.00 | $4.14 | $1.14 | 37.9% |
| Virginia | $2.81 | $3.86 | $1.05 | 37.5% |
| District of Columbia | $3.09 | $4.21 | $1.12 | 36.1% |
| North Carolina | $2.77 | $3.77 | $1.00 | 36.1% |
| West Virginia | $2.85 | $3.87 | $1.02 | 35.9% |
| Florida | $2.91 | $3.95 | $1.04 | 35.6% |
| New Jersey | $2.94 | $3.99 | $1.05 | 35.6% |
| Maryland | $2.92 | $3.94 | $1.02 | 35.0% |
| Delaware | $2.87 | $3.87 | $1.00 | 34.8% |
| Pennsylvania | $3.11 | $4.14 | $1.03 | 33.0% |
| Nevada | $3.64 | $4.78 | $1.14 | 31.2% |
| Indiana | $2.75 | $3.56 | $0.81 | 29.6% |
| Oregon | $3.71 | $4.76 | $1.05 | 28.3% |
| Washington | $4.17 | $5.24 | $1.07 | 25.7% |
| Hawaii | $4.40 | $5.43 | $1.03 | 23.4% |
| California | $4.59 | $5.59 | $1.00 | 21.8% |
Many of the states with the largest percentage increases started from relatively low pre-war prices, which magnified the percentage change as crude prices rose.
Oklahoma, for example, had the lowest baseline price in the country at $2.29 per gallon and has since climbed nearly 69%.
How Much More Americans Are Paying at the Pump
Across the country, the average increase works out to roughly $1.25 per gallon, or about 44% from the pre-war baseline.
That translates to an extra $15 for a 12-gallon fill-up. At roughly 450 gallons of fuel consumed per vehicle each year, based on Federal Highway Administration data, a sustained $1.25-per-gallon increase would add about $560 to annual fuel costs.
The increases followed a major global oil supply disruption after the Iran War closed the Strait of Hormuz, pushing oil prices sharply higher as roughly 10 million barrels per day were taken off the market.
The impact extends well beyond the pump. As a single barrel of oil feeds thousands of everyday products, from plastics to pharmaceuticals, higher crude prices can ripple across the broader economy.
Why the Least Affected States Still Pay the Most
The states with the smallest percentage increases were largely those already paying the most. High fuel taxes and climate-related fuel policies, including carbon pricing programs in California and Washington, help keep baseline prices elevated.
California also uses a state-mandated fuel blend that cannot easily be supplemented with gasoline from outside the state.
Hawaii faces a different constraint: as an island chain with no pipeline access, its fuel must be shipped in, adding a persistent logistical premium to each gallon.
California saw the smallest increase at 21.8%, followed by Hawaii at 23.4% and Washington at 25.7%. Yet all three remain the most expensive states in the country, at $5.59, $5.43, and $5.24 per gallon, respectively.
Learn More on the Voronoi App
If you enjoyed this graphic, check out Charted: The World’s Biggest Oil Producers on Voronoi.