How Much Does the American Dream Cost Across the U.S.?
Key Takeaways
- The American Dream costs an estimated $5.32 million over a household’s lifetime in 2026, including housing, raising children, healthcare, and retirement.
- Washington, D.C., is the most expensive location at $7.86 million, followed by Hawaii ($6.76 million) and California ($6.63 million).
- Mississippi is the least expensive state at $4.49 million, creating a $3.37 million gap between the highest- and lowest-cost locations.
Owning a home, raising a family, and retiring comfortably have long been cornerstones of the American Dream. But achieving these milestones comes with a multimillion-dollar lifetime price tag, and where Americans live can make a substantial difference.
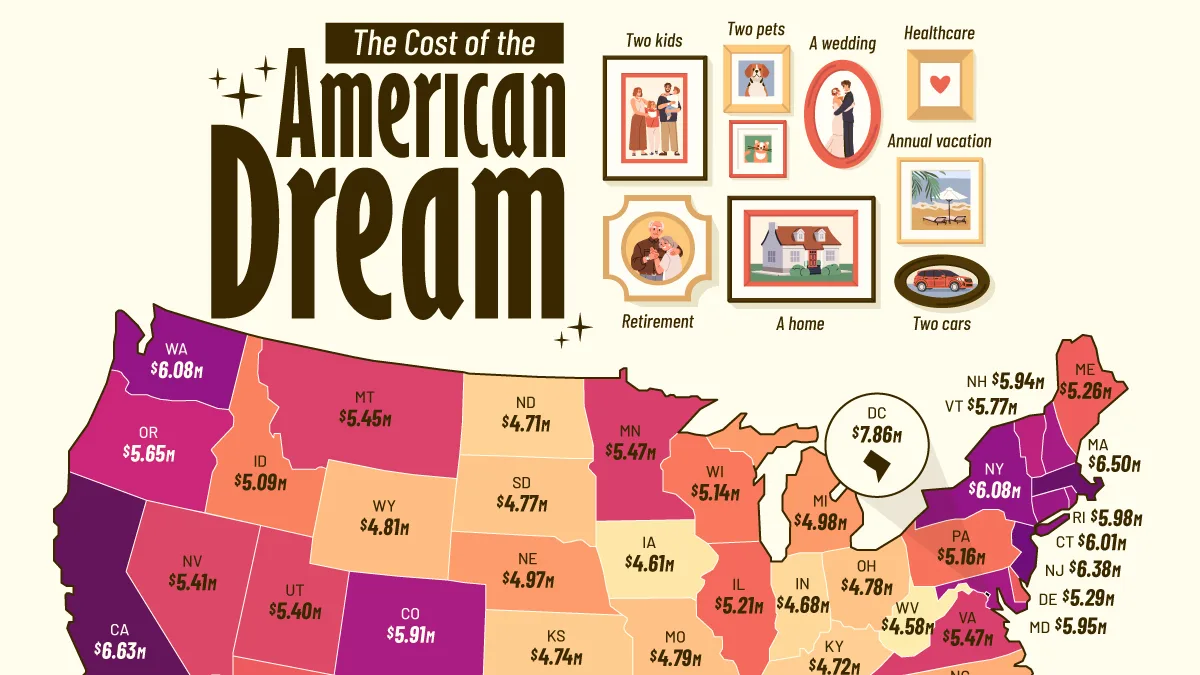
This graphic maps the estimated lifetime cost of the American Dream across all 50 states and Washington, D.C., based on 2026 data from Investopedia.
A $3.4 Million Gap in the American Dream
The ranking reveals how widely the cost of a traditional middle-class lifestyle varies across the country.
| Rank | State or District | 2026 Estimated Cost for a Household Over a Lifetime |
|---|---|---|
| 1 | Washington, DC | $7.86M |
| 2 | Hawaii | $6.76M |
| 3 | California | $6.63M |
| 4 | Massachusetts | $6.50M |
| 5 | New Jersey | $6.38M |
| 6 | Washington | $6.08M |
| 7 | New York | $6.08M |
| 8 | Connecticut | $6.01M |
| 9 | Rhode Island | $5.98M |
| 10 | Maryland | $5.95M |
| 11 | New Hampshire | $5.94M |
| 12 | Colorado | $5.91M |
| 13 | Vermont | $5.77M |
| 14 | Oregon | $5.65M |
| 15 | Minnesota | $5.47M |
| 16 | Virginia | $5.47M |
| 17 | Montana | $5.45M |
| 18 | Alaska | $5.45M |
| 19 | Nevada | $5.41M |
| 20 | Utah | $5.40M |
| 21 | Florida | $5.38M |
| 22 | Delaware | $5.29M |
| 23 | Arizona | $5.28M |
| 24 | Maine | $5.26M |
| 25 | Illinois | $5.21M |
| 26 | Pennsylvania | $5.16M |
| 27 | Wisconsin | $5.14M |
| 28 | Idaho | $5.09M |
| 29 | South Carolina | $5.05M |
| 30 | Texas | $5.04M |
| 31 | Michigan | $4.98M |
| 32 | Nebraska | $4.97M |
| 33 | Georgia | $4.95M |
| 34 | New Mexico | $4.90M |
| 35 | North Carolina | $4.88M |
| 36 | Wyoming | $4.81M |
| 37 | Missouri | $4.79M |
| 38 | Tennessee | $4.78M |
| 39 | Ohio | $4.78M |
| 40 | South Dakota | $4.77M |
| 41 | Kansas | $4.74M |
| 42 | Kentucky | $4.72M |
| 43 | North Dakota | $4.71M |
| 44 | Louisiana | $4.71M |
| 45 | Oklahoma | $4.69M |
| 46 | Indiana | $4.68M |
| 47 | Alabama | $4.64M |
| 48 | Iowa | $4.61M |
| 49 | West Virginia | $4.58M |
| 50 | Arkansas | $4.50M |
| 51 | Mississippi | $4.49M |
| — |  U.S. Average |
$5.32M |
Hawaii, California, Massachusetts, and New Jersey rank among the most expensive locations, with lifetime costs exceeding $6 million. Meanwhile, Arkansas, West Virginia, and Iowa are among the least expensive.
These differences extend beyond housing. Raising two children through age 17 costs an estimated $1.21 million in Washington, D.C., compared with $389,000 in Mississippi. Higher childcare costs, particularly for infants and toddlers, contribute to the gap, alongside regional differences in everyday living expenses.
Why Homeownership Costs $1.28 Million
Homeownership is the single largest expense in the national American Dream calculation, totaling an estimated $1.28 million. Of this amount, roughly $837,000 goes toward mortgage payments, while another $438,000 covers property taxes, insurance, maintenance, and utilities.
In Washington, D.C., the estimated lifetime cost of homeownership reaches $3.02 million, more than 3.5 times the $833,000 in West Virginia.
Property taxes and insurance also contribute to regional differences. Annual property taxes on a typical New Jersey home reach $11,200, compared with $1,150 in Alabama. Meanwhile, Florida’s average annual homeowners insurance premium is $8,500, nearly three times the national average.
Is the American Dream Taking Longer to Achieve?
The financial pressure is also reflected in America’s changing homebuyer demographics.
The median age of first-time homebuyers reached a record 40 in 2025. Meanwhile, just 24% of recent buyers had children under 18, compared with 58% in 1985.
These figures suggest that the traditional milestones of homeownership and raising a family are becoming less closely linked. While affordability is not the only factor, the rising age of first-time buyers highlights the difficulty of reaching major financial milestones earlier in adulthood.
How the Cost of the American Dream Was Calculated
Investopedia’s estimates combine the lifetime costs of eight major milestones: a 30-year mortgage with a 20% down payment; buying or financing two new cars every 10 years; saving for a 20-year retirement; raising two children through age 18 and paying for four years of public college; healthcare from ages 22 to 85; annual vacations from ages 22 to 84; owning a dog and cat for approximately 11–13 years; and an engagement ring, wedding ceremony, and reception.
The figures represent cumulative costs for a modeled household lifestyle over decades, rather than the income or savings required at any one time. They reflect one traditional version of the American Dream, not a universal definition of financial success.
Learn More on the Voronoi App
To learn more about this topic, check out this graphic exploring Americans’ declining belief in the American Dream.