Mapped: Median Household Income by State
See visuals like this from many other data creators on our Voronoi app. Download it for free on iOS or Android and discover incredible data-driven charts from a variety of trusted sources.
Key Takeaways
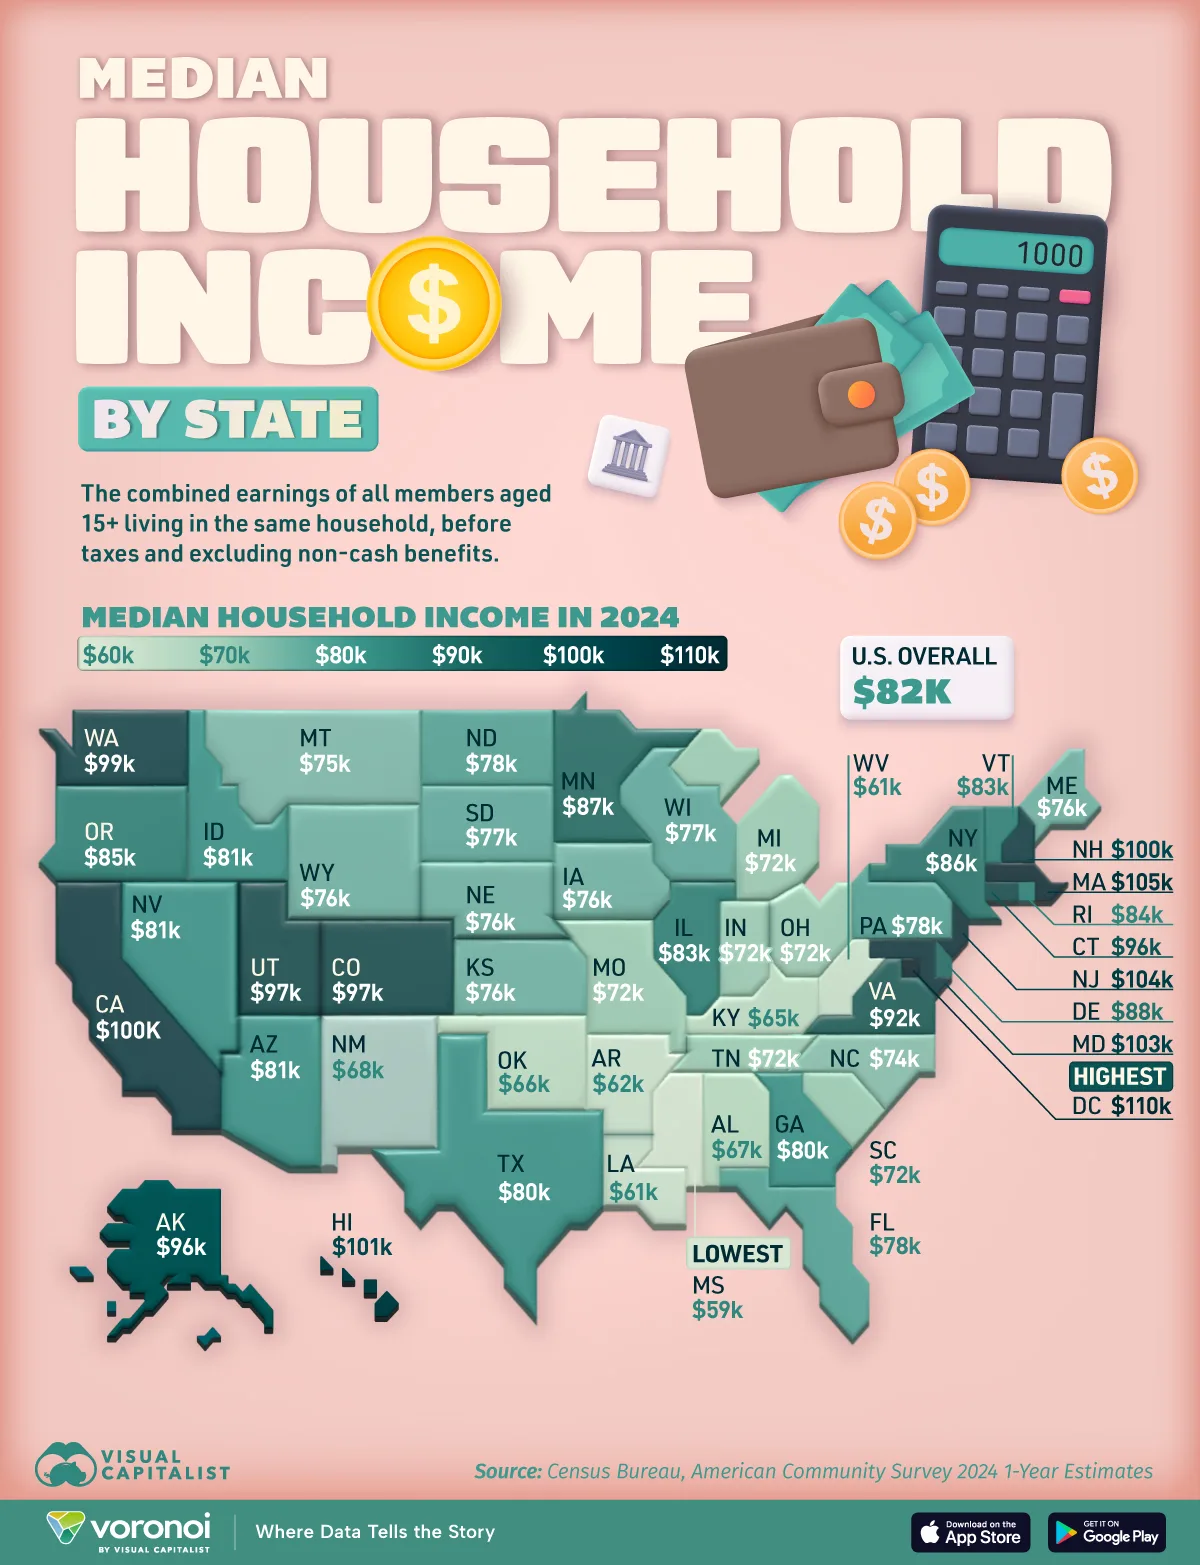
- Median household income by state in 2024 ranged from $59.1K in Mississippi to $109.7K in Washington D.C., revealing significant regional disparities.
- The top five states after the capital—Massachusetts, New Jersey, Maryland, Hawaii, and California—all had median household incomes above $100K, over 20% higher than the U.S. national median household income.
Across the United States, median household income by state varies widely depending on geography, industry mix, and cost of living.
This visualization maps out all 50 states by their 2024 median household income using data from the U.S. Census Bureau’s American Community Survey, the latest data available as of October 2025.
Median Household Income in the U.S. in 2024
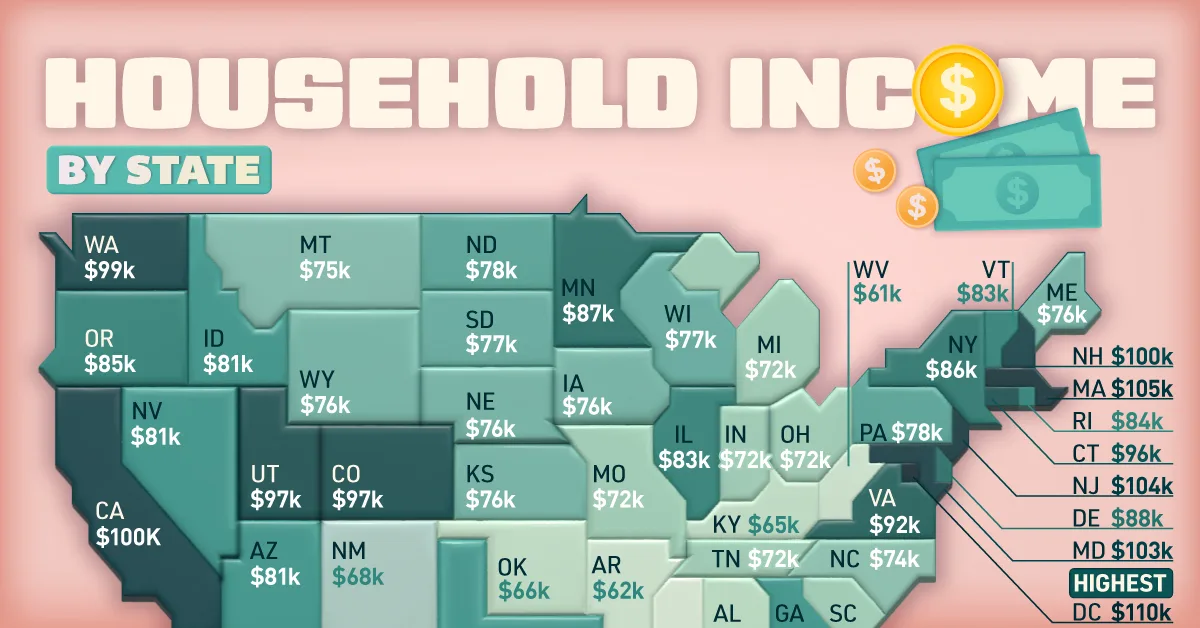
The median household income in the U.S. was $81,604 in 2024, with the District of Columbia having the highest of any state or district at $109,707, followed by various coastal states.
The data table below shows the median household income for every U.S. state along with the national median household income for 2024:
| State | Median household income in 2024 |
|---|---|
| Alabama | $66,659 |
| Alaska | $95,665 |
| Arizona | $81,486 |
| Arkansas | $62,106 |
| California | $100,149 |
| Colorado | $97,113 |
| Connecticut | $96,049 |
| Delaware | $87,534 |
| District of Columbia | $109,707 |
| Florida | $77,735 |
| Georgia | $79,991 |
| Hawaii | $100,745 |
| Idaho | $81,166 |
| Illinois | $83,211 |
| Indiana | $71,959 |
| Iowa | $75,501 |
| Kansas | $75,514 |
| Kentucky | $64,526 |
| Louisiana | $60,986 |
| Maine | $76,442 |
| Maryland | $102,905 |
| Massachusetts | $104,828 |
| Michigan | $72,389 |
| Minnesota | $87,117 |
| Mississippi | $59,127 |
| Missouri | $71,589 |
| Montana | $75,340 |
| Nebraska | $76,376 |
| Nevada | $81,134 |
| New Hampshire | $99,782 |
| New Jersey | $104,294 |
| New Mexico | $67,816 |
| New York | $85,820 |
| North Carolina | $73,958 |
| North Dakota | $77,871 |
| Ohio | $72,212 |
| Oklahoma | $66,148 |
| Oregon | $85,220 |
| Pennsylvania | $77,545 |
| Rhode Island | $83,504 |
| South Carolina | $72,350 |
| South Dakota | $76,881 |
| Tennessee | $71,997 |
| Texas | $79,721 |
| Utah | $96,658 |
| Vermont | $82,730 |
| Virginia | $92,090 |
| Washington | $99,389 |
| West Virginia | $60,798 |
| Wisconsin | $77,488 |
| Wyoming | $75,532 |
| National Average | $81,604 |
The data shows a significant difference between high and low-income states, with nearly a $51,000 difference between Washington D.C. and the lowest-earning state of Mississippi which has a median household income of $59,127.
High-Earning States Concentrated on the Coasts
The states with the highest household earnings are heavily concentrated along the coasts, with Colorado being the highest-earning landlocked state at ninth on the list with $97,113. Utah is the next non-coastal state with a high level of household earnings at $96,658, ranking 10th overall.
The eight coastal states ahead of Colorado and Utah all had a median household income of at least $99,000, all at least 20% above the national median household income.
These coastal states benefit from robust technology, professional services, and government sectors that tend to offer higher-paying jobs, while also often having higher costs of living.
Southern States Lag Behind the National Median Income
States in the South continue to have many of the lowest household incomes in the U.S., often trailing significantly behind the national median of $81,604.
After Mississippi at $59,127, the next two lowest-earning states were West Virginia ($60,798) and Louisiana ($60,986).
Other states below $65,000 (20% below the national median) were Arkansas and Kentucky with $62,106 and $64,526 in median household income respectively.
While these figures are significantly below the national median, they do coincide with lower housing and living costs, providing a more balanced standard of living.
Learn More on the Voronoi App 
To learn more about the state of household finances across America, check out this graphic showing the average credit card debt of every state in the United States.