Which States Have the Highest Electricity Costs?
This was originally posted on our Voronoi app. Download the app for free on iOS or Android and discover incredible data-driven charts from a variety of trusted sources.
Key Takeaways
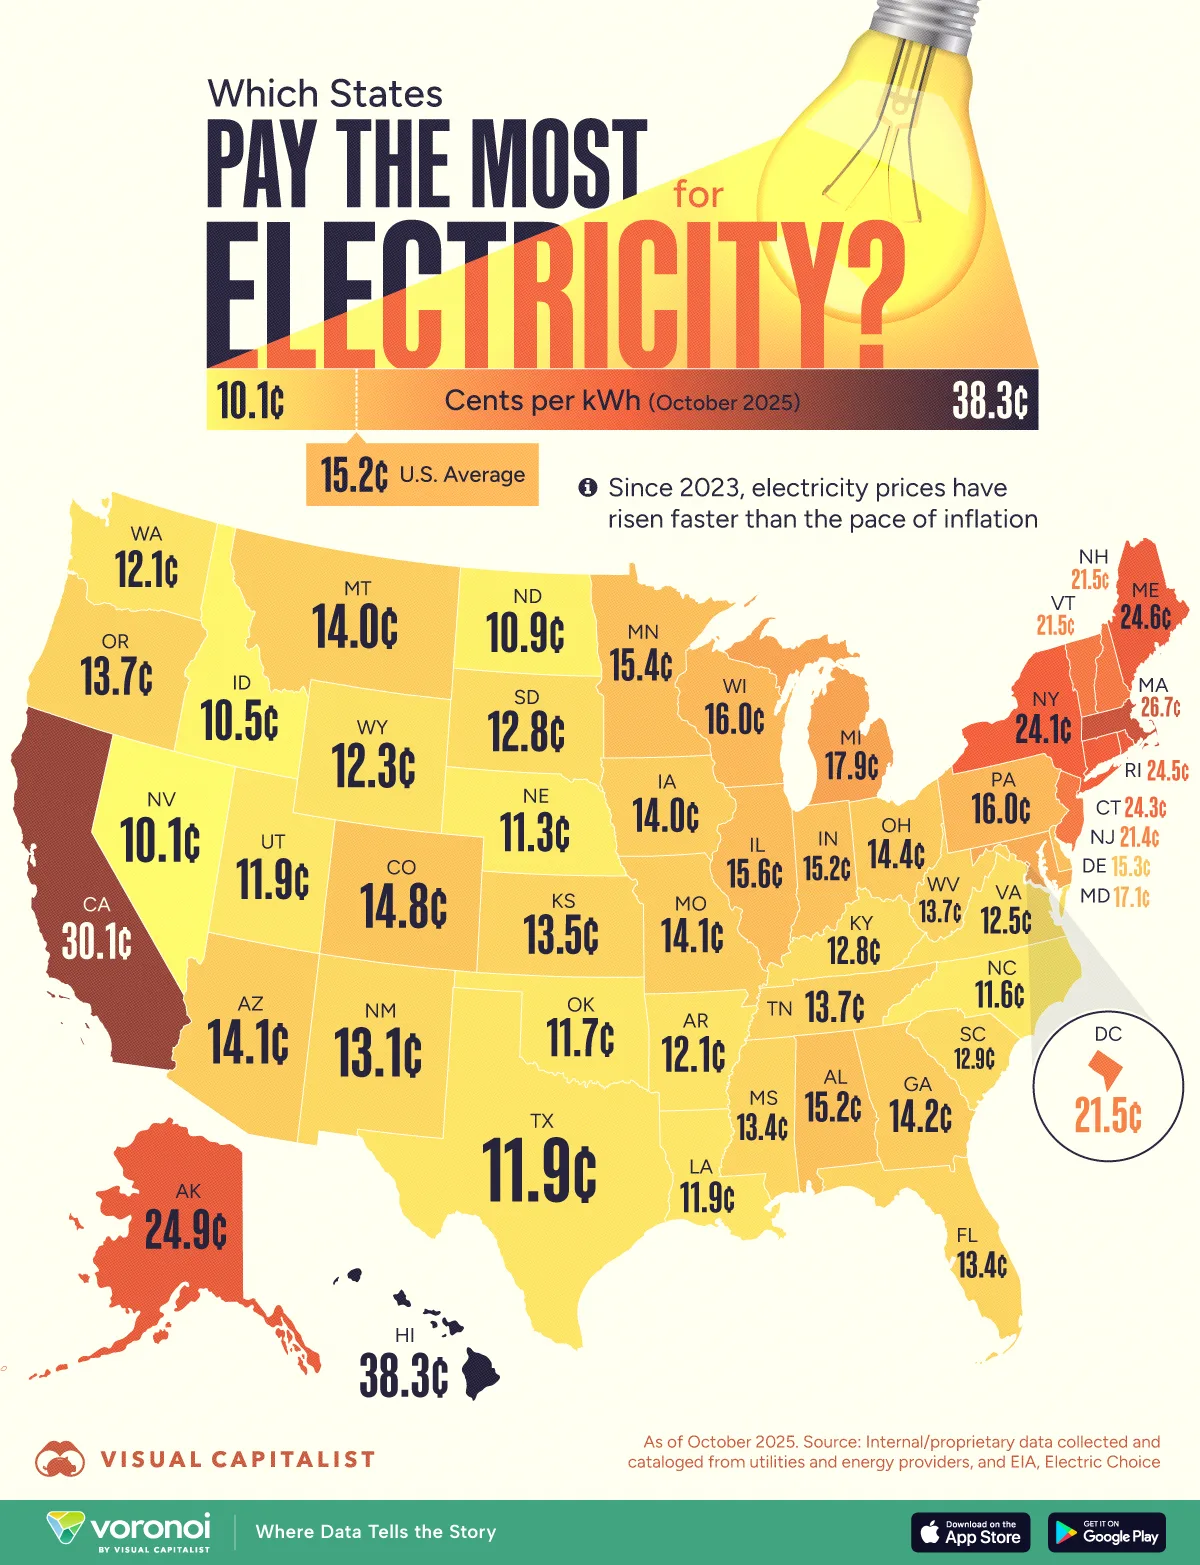
- Hawaii stands out with a residential rate of 40.96¢ and commercial rate of 35.54¢ per kWh, more than double the U.S. average.
- States like Connecticut, California, Rhode Island, and Massachusetts consistently rank in the top tier for electricity costs. These regions often have higher infrastructure costs, stricter environmental regulations, and more renewables.
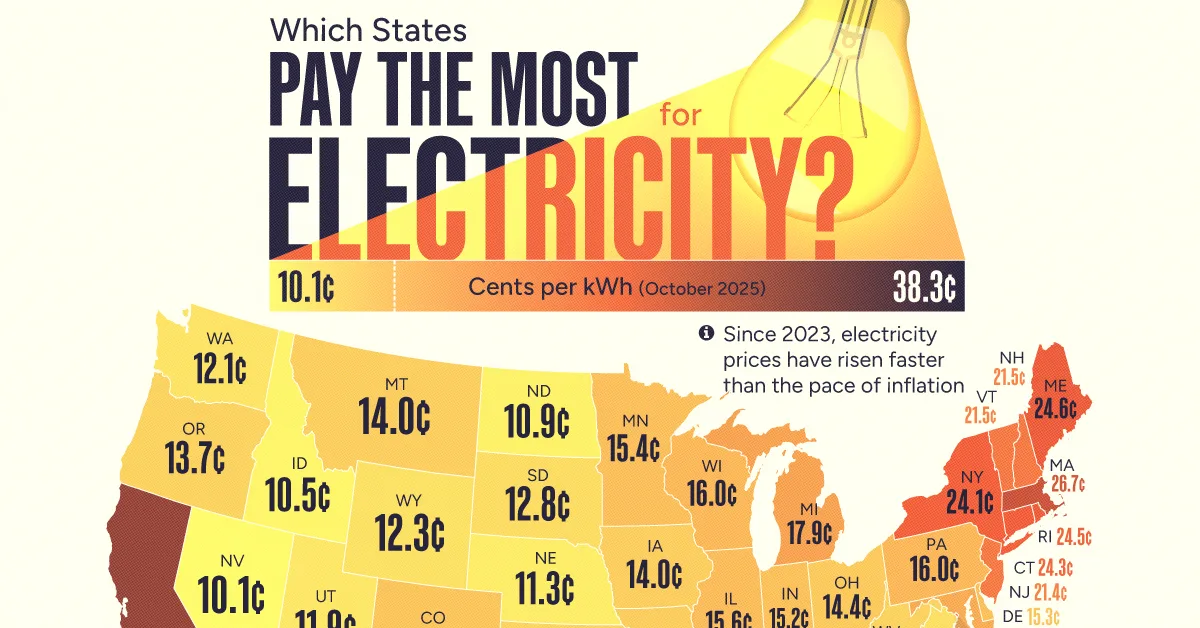
Electricity costs vary widely across the United States, reflecting a combination of geography, infrastructure, fuel mix, and policy.
This visualization ranks states based on average electricity rates, taking into account both residential and commercial rates. The data for this visualization comes from Electric Choice.
Hawaii: The Nation’s Highest Electricity Costs
Hawaii leads the country by a wide margin with residential rates at 40.96¢ and commercial at 35.54¢ per kWh. Because Hawaii is geographically isolated, it depends heavily on imported petroleum for power generation. These logistical challenges drive up generation and delivery costs significantly.
| State ▲ | Residential (¢/kWh) | Commercial (¢/kWh) | Average (Res. & Com.) |
|---|---|---|---|
| Hawaii | 40.96 | 35.54 | 38.25¢ per kWh |
| California | 33.52 | 26.69 | 30.11¢ per kWh |
| Massachusetts | 30.37 | 23.10 | 26.74¢ per kWh |
| Alaska | 26.88 | 22.93 | 24.91¢ per kWh |
| Maine | 28.14 | 21.05 | 24.60¢ per kWh |
| Rhode Island | 26.84 | 22.15 | 24.50¢ per kWh |
| Connecticut | 27.24 | 21.36 | 24.30¢ per kWh |
| New York | 26.53 | 21.72 | 24.13¢ per kWh |
| District of Columbia | 22.7 | 20.37 | 21.54¢ per kWh |
| Vermont | 23.21 | 19.79 | 21.50¢ per kWh |
| New Hampshire | 23.51 | 19.46 | 21.49¢ per kWh |
| New Jersey | 24.88 | 18.00 | 21.44¢ per kWh |
| Michigan | 20.85 | 14.87 | 17.86¢ per kWh |
| Maryland | 19.33 | 14.82 | 17.08¢ per kWh |
| Pennsylvania | 19.7 | 12.37 | 16.04¢ per kWh |
| Wisconsin | 18.57 | 13.36 | 15.97¢ per kWh |
| Illinois | 18.33 | 12.86 | 15.60¢ per kWh |
| Minnesota | 17.14 | 13.63 | 15.39¢ per kWh |
| Delaware | 18.15 | 12.45 | 15.30¢ per kWh |
| Alabama | 16 | 14.44 | 15.22¢ per kWh |
| U.S. Average | 17.47 | 12.96 | 15.22¢ per kWh |
| Indiana | 16.6 | 13.71 | 15.16¢ per kWh |
| Colorado | 16.16 | 13.51 | 14.84¢ per kWh |
| Ohio | 17.52 | 11.35 | 14.44¢ per kWh |
| Georgia | 16 | 12.37 | 14.19¢ per kWh |
| Arizona | 15.28 | 12.98 | 14.13¢ per kWh |
| Missouri | 15.84 | 12.42 | 14.13¢ per kWh |
| Iowa | 15.39 | 12.64 | 14.02¢ per kWh |
| Montana | 14.85 | 13.14 | 14.00¢ per kWh |
| Tennessee | 13.98 | 13.49 | 13.74¢ per kWh |
| Oregon | 15.77 | 11.60 | 13.69¢ per kWh |
| West Virginia | 15.82 | 11.49 | 13.66¢ per kWh |
| Kansas | 15 | 12.07 | 13.54¢ per kWh |
| Florida | 15.36 | 11.48 | 13.42¢ per kWh |
| Mississippi | 13.94 | 12.85 | 13.40¢ per kWh |
| New Mexico | 14.77 | 11.46 | 13.12¢ per kWh |
| South Carolina | 14.71 | 11.00 | 12.86¢ per kWh |
| Kentucky | 13.62 | 11.88 | 12.75¢ per kWh |
| South Dakota | 14.23 | 11.27 | 12.75¢ per kWh |
| Virginia | 15.41 | 9.66 | 12.54¢ per kWh |
| Wyoming | 14.89 | 9.78 | 12.34¢ per kWh |
| Washington | 12.98 | 11.30 | 12.14¢ per kWh |
| Arkansas | 13.33 | 10.84 | 12.09¢ per kWh |
| Texas | 15.23 | 8.60 | 11.92¢ per kWh |
| Louisiana | 12.64 | 11.15 | 11.90¢ per kWh |
| Utah | 13.12 | 10.58 | 11.85¢ per kWh |
| Oklahoma | 13.62 | 9.77 | 11.70¢ per kWh |
| North Carolina | 13.33 | 9.76 | 11.55¢ per kWh |
| Nebraska | 13.17 | 9.35 | 11.26¢ per kWh |
| North Dakota | 13.68 | 8.05 | 10.87¢ per kWh |
| Idaho | 12.07 | 9.00 | 10.54¢ per kWh |
| Nevada | 11.42 | 8.80 | 10.11¢ per kWh |
New England and California Among the Priciest
California (30.11¢), Massachusetts (26.74¢), Alaska (24.91¢), and Maine (24.60¢) round out the top five for electricity costs. These areas often have dense populations, older infrastructure, and progressive energy policies.
Investments in clean energy and grid upgrades can also raise prices in the short term, even if they lead to long-term savings or environmental benefits.
States with the Cheapest Power
On the other end of the spectrum, states like Nevada (10.11¢), Idaho (10.54¢), and North Dakota (10.87¢) offer some of the lowest electricity rates. These states benefit from abundant natural resources like hydro, coal, or wind. In addition, they tend to have lower regulatory costs and less congestion on their power grids.
Texas stands out with a significant 6.63¢ gap between residential (15.23¢) and commercial (8.60¢) rates. This difference reflects the state’s deregulated energy market, which allows for more competitive pricing structures.
Learn More on the Voronoi App 
If you enjoyed today’s post, check out Visualized: The Top Countries Buying U.S. Oil in 2024 on Voronoi, the new app from Visual Capitalist.