Mapped: The Cost of Living Across America
See visuals like this from many other data creators on our Voronoi app. Download it for free on iOS or Android and discover incredible data-driven charts from a variety of trusted sources.
Key Takeaways
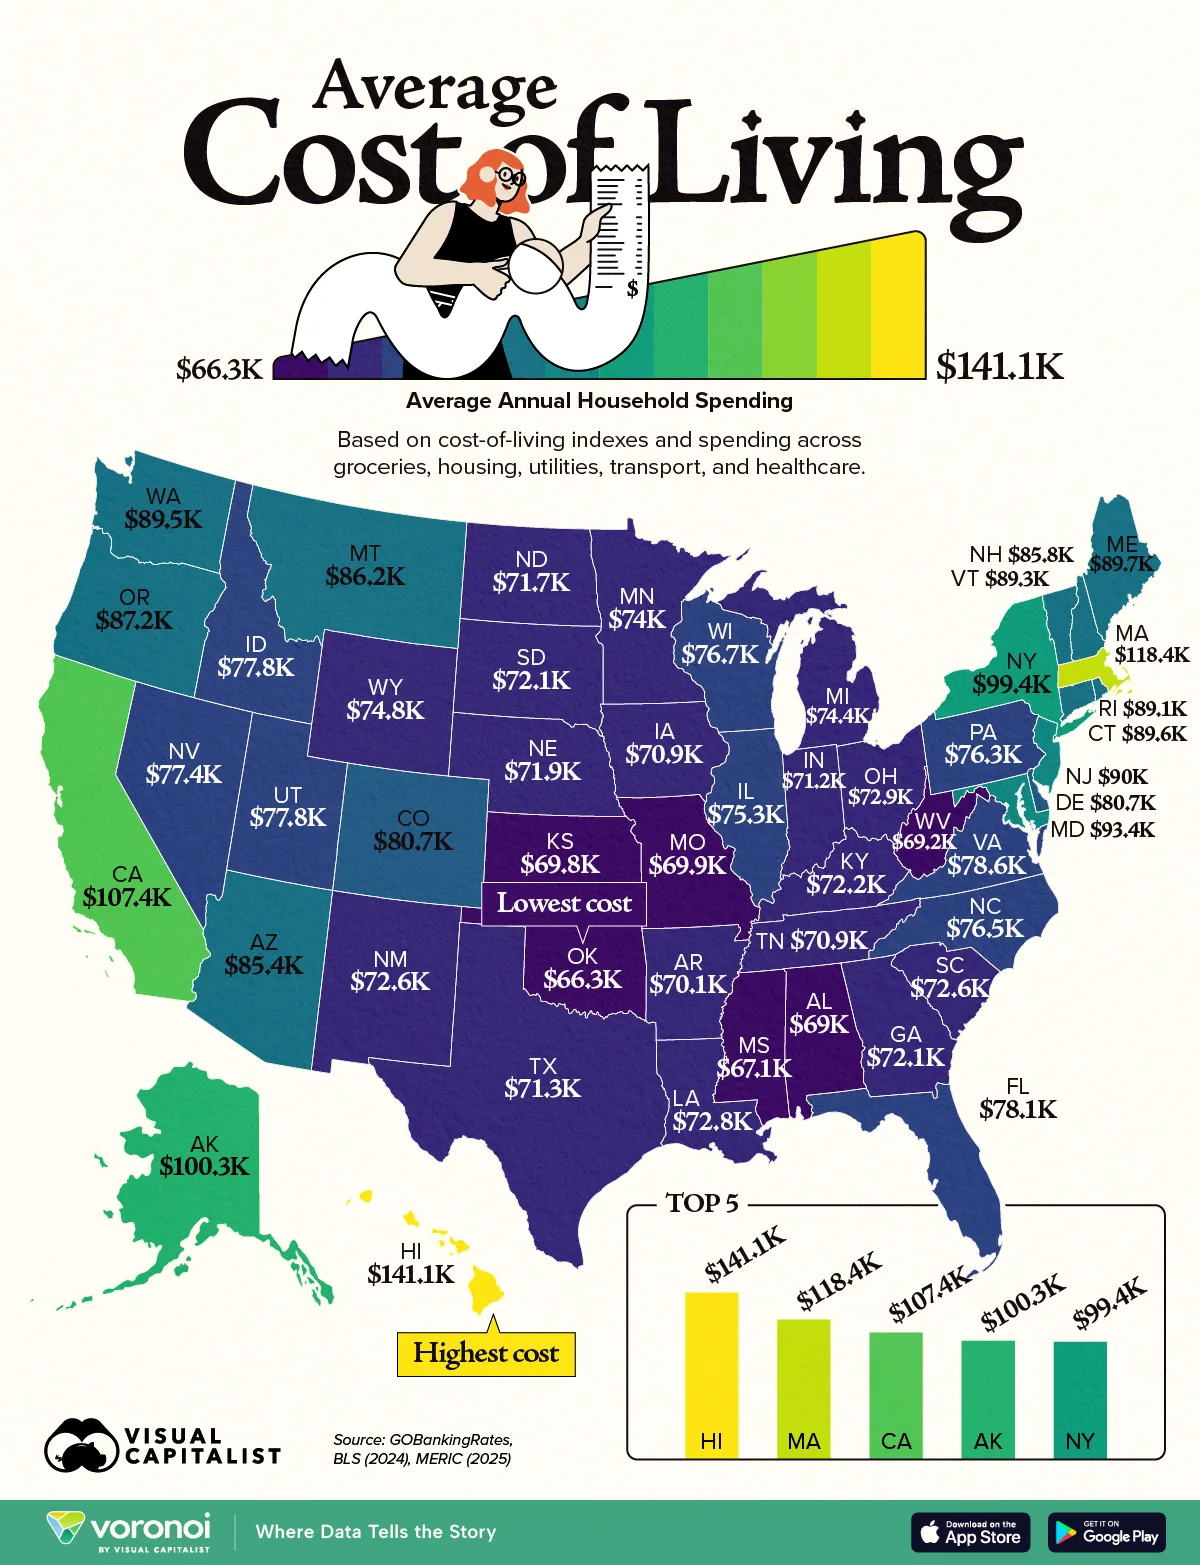
- Hawaii is the most expensive state, with annual household costs reaching $141,127.
- Oklahoma is the cheapest at $66,284, creating a gap of roughly $75,000 per year.
- Most states cluster between roughly $70,000 and $90,000, while coastal and remote states tend to cost far more.
Living in one U.S. state versus another can change your annual costs by as much as $75,000.
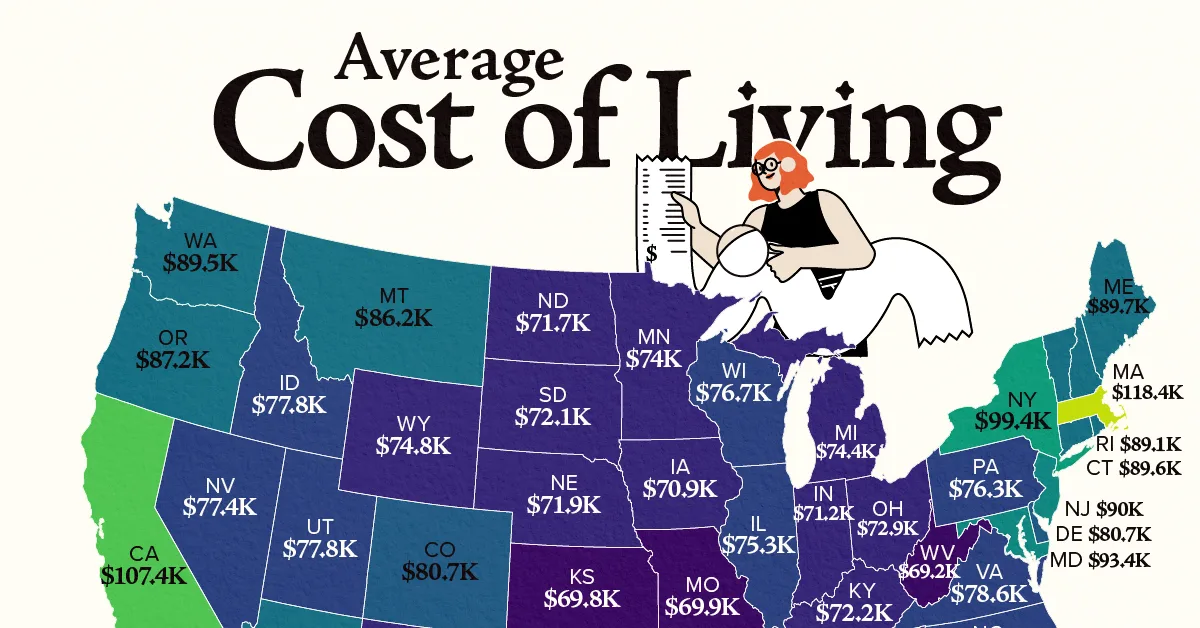
Using GOBankingRate’s analysis of the Bureau of Labor Statistics’ 2024 Consumer Expenditure Survey and Missouri Economic Research and Information Center data as of Q3 2025, this map shows how annual household costs vary across all 50 states.
From $141,127 in Hawaii to $66,284 in Oklahoma, the difference is stark. For many households, location alone can be one of the biggest drivers of overall cost.
The Most Expensive States to Live In
Hawaii tops the list at $141,127 per year, making it the most expensive state by a wide margin. That is about $75,000 more than Oklahoma and roughly $63,000 above the U.S. average.
In many cases, paying off a home in the Aloha State requires multi-generational efforts due to steep housing costs. Residents also pay 28% more for healthcare and 33% more for groceries than the national average.
This table shows average household expenditures by state, based on cost-of-living indexes and consumer spending across groceries, housing, utilities, transportation, and healthcare:
| Rank | State | Annual Average Expenditures | Cost-of-Living Index |
|---|---|---|---|
| 1 | Hawaii | $141,127 | 179.7 |
| 2 | Massachusetts | $118,431 | 150.8 |
| 3 | California | $107,357 | 136.7 |
| 4 | Alaska | $100,289 | 127.7 |
| 5 | New York | $99,425 | 126.6 |
| 6 | Maryland | $93,378 | 118.9 |
| 7 | New Jersey | $90,001 | 114.6 |
| 8 | Maine | $89,687 | 114.2 |
| 9 | Connecticut | $89,608 | 114.1 |
| 10 | Washington | $89,451 | 113.9 |
| 11 | Vermont | $89,294 | 113.7 |
| 12 | Rhode Island | $89,059 | 113.4 |
| 13 | Oregon | $87,231 | 111.8 |
| 14 | Montana | $86,231 | 109.8 |
| 15 | New Hampshire | $85,760 | 109.2 |
| 16 | Arizona | $85,446 | 108.8 |
| 17 | Delaware | $80,734 | 102.8 |
| 18 | Colorado | $80,655 | 102.7 |
| 19 | Virginia | $78,614 | 100.1 |
| 20 | Florida | $78,142 | 99.5 |
| 21 | Utah | $77,828 | 99.1 |
| 22 | Idaho | $77,750 | 99.0 |
| 23 | Nevada | $77,436 | 98.6 |
| 24 | Wisconsin | $76,729 | 97.7 |
| 25 | North Carolina | $76,493 | 97.4 |
| 26 | Pennsylvania | $76,257 | 97.1 |
| 27 | Illinois | $75,315 | 95.9 |
| 28 | Wyoming | $74,844 | 95.3 |
| 29 | Michigan | $74,373 | 94.7 |
| 30 | Minnesota | $73,980 | 94.2 |
| 31 | Ohio | $72,880 | 92.8 |
| 32 | Louisiana | $72,802 | 92.7 |
| 33 | New Mexico | $72,645 | 92.5 |
| 34 | South Carolina | $72,645 | 92.5 |
| 35 | Kentucky | $72,174 | 91.9 |
| 36 | Georgia | $72,095 | 91.8 |
| 37 | South Dakota | $72,095 | 91.8 |
| 38 | Nebraska | $71,938 | 91.6 |
| 39 | North Dakota | $71,702 | 91.3 |
| 40 | Texas | $71,310 | 90.8 |
| 41 | Indiana | $71,153 | 90.6 |
| 42 | Iowa | $70,917 | 90.3 |
| 43 | Tennessee | $70,917 | 90.3 |
| 44 | Arkansas | $70,132 | 89.3 |
| 45 | Missouri | $69,896 | 89.0 |
| 46 | Kansas | $69,818 | 88.9 |
| 47 | West Virginia | $69,189 | 88.1 |
| 48 | Alabama | $69,032 | 87.9 |
| 49 | Mississippi | $67,147 | 85.5 |
| 50 | Oklahoma | $66,284 | 84.4 |
Massachusetts ($118,431), California ($107,357), Alaska ($100,289), and New York ($99,425) round out the top five, reflecting a mix of housing pressure, geographic isolation, and higher overall costs.
The Cheapest States to Live In
In Oklahoma, average annual household spending is $66,284, making it the most affordable state overall.
With the median home sale price in Oklahoma City at $240,000, housing remains relatively affordable, with prices rising just 1% year over year as of December 2025. By contrast, the U.S. median stood at nearly $359,000.
Meanwhile, the state benefits from lower gas prices than Texas due to lower taxes and regional supply advantages, along with some of the most affordable groceries in the country.
Mississippi ranks second at $67,147, where annual living costs are more than $10,000 lower than in Florida.
Texas ranks 11th, with average spending of $71,310. Despite strong interstate migration, robust home construction has helped ease pressure on prices. Notably, home prices in Houston fell 2.2% annually last year to about $302,000.
The map highlights a clear reality: in the U.S., location alone can shift annual living costs by tens of thousands of dollars. For households considering a move, that difference can rival the impact of income itself.
Learn More on the Voronoi App 
To learn more about this topic, check out this graphic on the global cost of living index in 2026.