Mapped: The Highest Weekly Wages in America
See visuals like this from many other data creators on our Voronoi app. Download the app for free on iOS or Android and discover incredible data-driven charts from a variety of trusted sources.
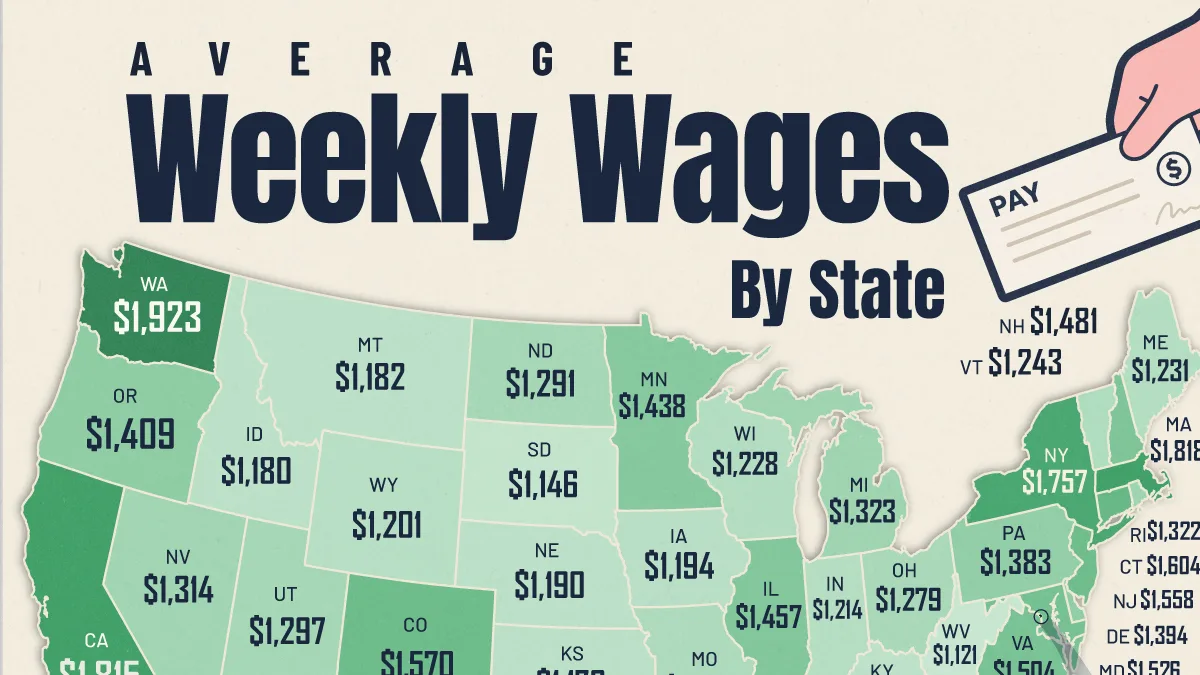
Key Takeaways:
- Washington, D.C. workers earn nearly $2,400 per week on average, far above every U.S. state.
- Washington, Massachusetts, and California rank among the top-paying states thanks to tech, finance, and professional services.
- The lowest-paying states average under $1,150 per week, highlighting America’s widening regional income gap.
Where Americans live can have a massive impact on how much they earn each week. In the highest-paying parts of the country, average wages are nearly double those in the lowest-paying states.
This map shows average weekly wages across all 50 states and Washington, D.C., using data from the U.S. Bureau of Labor Statistics’ Quarterly Census of Employment and Wages (QCEW).
Washington, D.C. ranks far above every state at nearly $2,400 per week on average, driven by high concentrations of government, legal, and consulting jobs. Meanwhile, states powered by technology and finance sectors, including Washington, Massachusetts, and California, also rank near the top.
On the flipside, many lower-wage states rely more heavily on agriculture, tourism, food services, and lower-wage industries.
Ranking Weekly Wages by U.S. State
The table below shows average weekly wages by state.
| Rank | State or District | Average Weekly Wage |
|---|---|---|
| 1 | District of Columbia | $2,393 |
| 2 | Washington | $1,923 |
| 3 | Massachusetts | $1,818 |
| 4 | California | $1,815 |
| 5 | New York | $1,757 |
| 6 | Connecticut | $1,604 |
| 7 | Colorado | $1,570 |
| 8 | New Jersey | $1,558 |
| 9 | Maryland | $1,526 |
| 10 | Virginia | $1,504 |
| 11 | New Hampshire | $1,481 |
| 12 | Illinois | $1,457 |
| 13 | Alaska | $1,455 |
| 14 | Texas | $1,444 |
| 15 | Minnesota | $1,438 |
| 16 | Oregon | $1,409 |
| 17 | Delaware | $1,394 |
| 18 | Pennsylvania | $1,383 |
| 19 | Arizona | $1,360 |
| 20 | Georgia | $1,349 |
| 21 | Florida | $1,342 |
| 22 | Hawaii | $1,342 |
| 23 | North Carolina | $1,328 |
| 24 | Tennessee | $1,327 |
| 25 | Michigan | $1,323 |
| 26 | Rhode Island | $1,322 |
| 27 | Nevada | $1,314 |
| 28 | Utah | $1,297 |
| 29 | North Dakota | $1,291 |
| 30 | Ohio | $1,279 |
| 31 | Missouri | $1,249 |
| 32 | Vermont | $1,243 |
| 33 | Maine | $1,231 |
| 34 | Wisconsin | $1,228 |
| 35 | Indiana | $1,214 |
| 36 | Alabama | $1,212 |
| 37 | Wyoming | $1,201 |
| 38 | South Carolina | $1,198 |
| 39 | Iowa | $1,194 |
| 40 | Nebraska | $1,190 |
| 41 | New Mexico | $1,190 |
| 42 | Louisiana | $1,187 |
| 43 | Montana | $1,182 |
| 44 | Idaho | $1,180 |
| 45 | Kansas | $1,179 |
| 46 | Kentucky | $1,176 |
| 47 | South Dakota | $1,146 |
| 48 | Oklahoma | $1,143 |
| 49 | Arkansas | $1,135 |
| 50 | West Virginia | $1,121 |
| 51 | Mississippi | $1,005 |
| — |  U.S. Average U.S. Average |
$1,459 |
Why Some States Pay Far More Than Others
Washington, D.C.’s top position reflects a highly unusual labor market. Federal agencies, defense contractors, law firms, consulting firms, and lobbying organizations create a dense cluster of high-paying professional jobs rarely seen elsewhere in the country.
Washington state’s strong wage performance stems from a different mix. Seattle’s technology sector, anchored by Amazon and Microsoft, has pushed wages higher across software, cloud computing, and engineering. At the same time, Boeing and its aerospace supply chain continue to support high-paying manufacturing jobs.
By comparison, the five lowest-wage states all average below $1,150 per week. These states tend to rely more heavily on agriculture, tourism, food services, retail, and other lower-wage industries.
Higher Wages Don’t Always Mean Greater Affordability
Weekly wages across the U.S. have risen substantially over the past several years, particularly following the pandemic-era labor shortage. According to BLS data, wage growth accelerated as employers competed for workers in sectors facing staffing shortages.
Higher wages do not always translate into greater financial comfort. Many of the nation’s top-paying states also have some of America’s highest housing costs, creating a tradeoff between bigger paychecks and a higher cost of living.
This disconnect helps explain growing concerns about affordability. In fact, workers in many advanced economies are increasingly questioning whether longer work hours truly translate into better quality of life, especially when compared with working hours and salaries across OECD countries.
What These Wage Gaps Mean for Workers
Regional wage disparities influence everything from migration patterns to housing demand and retirement decisions. Workers in lower-paying states may benefit from cheaper housing and lower living costs, but they often face fewer opportunities for career advancement and wealth accumulation.
Meanwhile, higher-paying states continue attracting skilled workers in technology, finance, healthcare, and engineering. But these gains can come with tradeoffs, including rising home prices and growing income inequality within metro areas.
The map underscores a growing divide in the American economy. Geography now plays a major role not only in earning potential, but also in long-term opportunities for wealth, housing, and career mobility.
Learn More on the Voronoi App 
If you enjoyed this post, check out Mapped: The Average Hourly Wage by State on the Voronoi app for more data-driven insights on incomes, employment, and the changing labor market.Use This Visualization