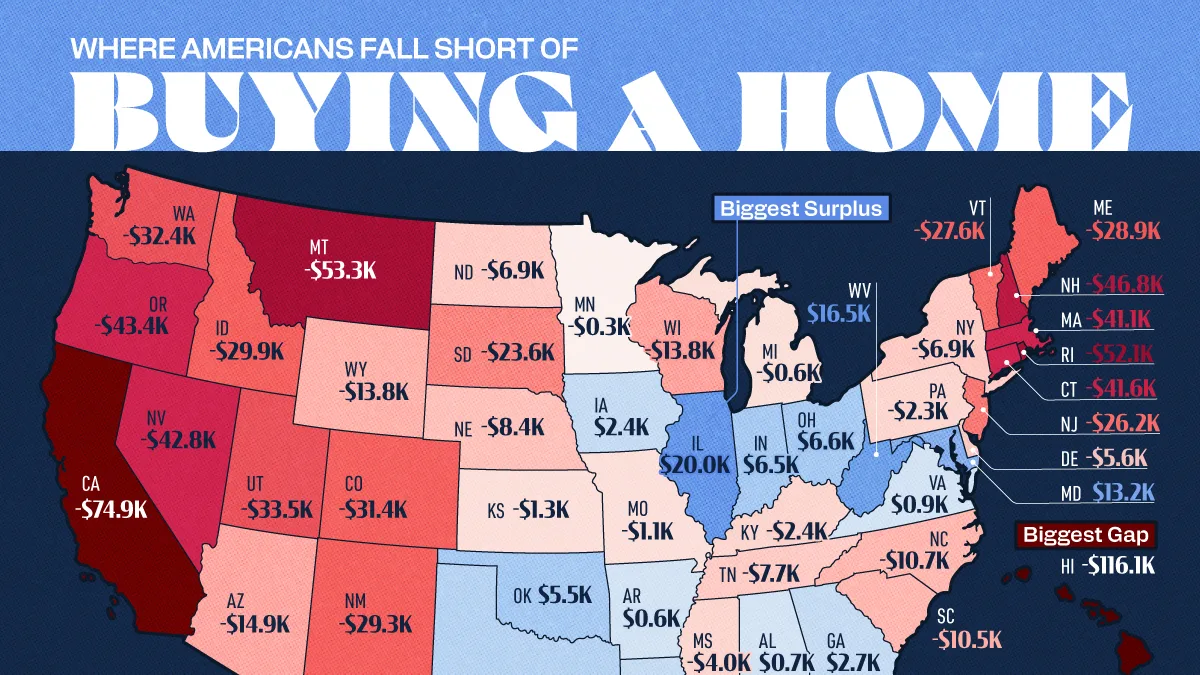
Mapped: The Homebuying Income Gap in Every U.S. State
Key Takeaways
- In 37 states, median household income falls below the estimated income needed to comfortably buy a median-priced home.
- Hawaii has the widest affordability gap at $116,053, while Illinois has the largest income surplus at $20,002.
- Montana has the third-largest shortfall at $53,307, despite a median household income of just $72,509.
For many Americans, the income required to comfortably buy a home has moved beyond what the typical household earns.
This map compares each state’s median household income with the estimated income needed to comfortably afford a median-priced home.
The data for this visualization comes from MoneyLion, based on data from the U.S. Census Bureau, Zillow, FRED, and the Missouri Economic Research and Information Center.
Hawaii Has the Largest Homebuying Income Gap
Hawaii has the largest homebuying income gap by a wide margin. Its median household earns $100,389, compared with an estimated $216,442 needed to comfortably buy a median-priced home, creating a $116,053 shortfall.
California ranks second with a gap of $74,928.
| State | Median Household Income (2026) | Income Needed to Buy a Home | Income Gap |
|---|---|---|---|
| Hawaii | $100,389 | $216,442 | -$116,053 |
| California | $99,122 | $174,050 | -$74,928 |
| Montana | $72,509 | $125,816 | -$53,307 |
| Rhode Island | $87,796 | $139,853 | -$52,057 |
| New Hampshire | $99,031 | $145,783 | -$46,752 |
| Oregon | $83,011 | $126,435 | -$43,424 |
| Nevada | $78,260 | $121,092 | -$42,832 |
| Connecticut | $95,781 | $137,379 | -$41,598 |
| Massachusetts | $103,960 | $145,036 | -$41,076 |
| Utah | $95,166 | $128,653 | -$33,487 |
| Washington | $98,141 | $130,546 | -$32,405 |
| Colorado | $95,470 | $126,892 | -$31,422 |
| Idaho | $77,800 | $107,690 | -$29,890 |
| New Mexico | $64,059 | $93,379 | -$29,320 |
| Maine | $74,733 | $103,662 | -$28,929 |
| Vermont | $81,203 | $108,774 | -$27,571 |
| New Jersey | $103,556 | $129,718 | -$26,162 |
| Florida | $74,568 | $99,314 | -$24,746 |
| South Dakota | $75,081 | $98,673 | -$23,592 |
| Arizona | $79,964 | $94,893 | -$14,929 |
| Wyoming | $76,176 | $89,987 | -$13,811 |
| Wisconsin | $77,485 | $91,271 | -$13,786 |
| North Carolina | $72,388 | $83,126 | -$10,738 |
| South Carolina | $69,324 | $79,787 | -$10,463 |
| Alaska | $92,788 | $102,595 | -$9,807 |
| Nebraska | $76,475 | $84,906 | -$8,431 |
| Tennessee | $69,595 | $77,251 | -$7,656 |
| New York | $85,974 | $92,868 | -$6,894 |
| North Dakota | $76,657 | $83,524 | -$6,867 |
| Delaware | $84,954 | $90,553 | -$5,599 |
| Mississippi | $56,447 | $60,427 | -$3,980 |
| Kentucky | $63,726 | $66,080 | -$2,354 |
| Pennsylvania | $77,971 | $80,224 | -$2,253 |
| Kansas | $74,275 | $75,536 | -$1,261 |
| Missouri | $70,702 | $71,843 | -$1,141 |
| Michigan | $72,875 | $73,437 | -$562 |
| Minnesota | $89,062 | $89,407 | -$345 |
| Arkansas | $60,773 | $60,189 | $584 |
| Alabama | $63,999 | $63,333 | $666 |
| Virginia | $93,170 | $92,266 | $904 |
| Iowa | $75,059 | $72,626 | $2,433 |
| Louisiana | $60,756 | $58,104 | $2,652 |
| Georgia | $77,353 | $74,695 | $2,658 |
| Texas | $78,476 | $73,916 | $4,560 |
| Oklahoma | $65,039 | $59,557 | $5,482 |
| Indiana | $71,957 | $65,458 | $6,499 |
| Ohio | $71,389 | $64,811 | $6,578 |
| Maryland | $103,678 | $90,477 | $13,201 |
| West Virginia | $59,608 | $43,157 | $16,451 |
| Illinois | $83,390 | $63,388 | $20,002 |
Affordability Pressures Extend Beyond the Coasts
Some of the largest affordability gaps appear outside the country’s famously expensive coastal housing markets.
Montana ranks third nationally with a $53,307 shortfall, while Utah, Idaho, and Colorado also record gaps of roughly $30,000 or more.
Several New England states face similarly large differences, including Rhode Island, New Hampshire, Connecticut, and Massachusetts.
Where Incomes Still Stretch Far Enough
At the other end of the ranking, Illinois has the strongest position, with median household income exceeding the estimated homebuying requirement by $20,002.
West Virginia follows with a surplus of $16,451, while Maryland has a surplus of $13,201.
Ohio, Indiana, Oklahoma, and Texas also have median household incomes that clear the estimated affordability threshold.
Still, several states sit right on the edge. Arkansas, Alabama, and Virginia have positive gaps of less than $1,000, suggesting only a slim affordability cushion for the typical household.
Learn More on the Voronoi App 
If you enjoyed today’s post, check out Ranked: U.S. States With the Widest Wage Gaps on Voronoi.