The Income a Family Needs to Be Middle Class, by U.S. State
This was originally posted on our Voronoi app. Download the app for free on iOS or Android and discover incredible data-driven charts from a variety of trusted sources.
Key Takeaways
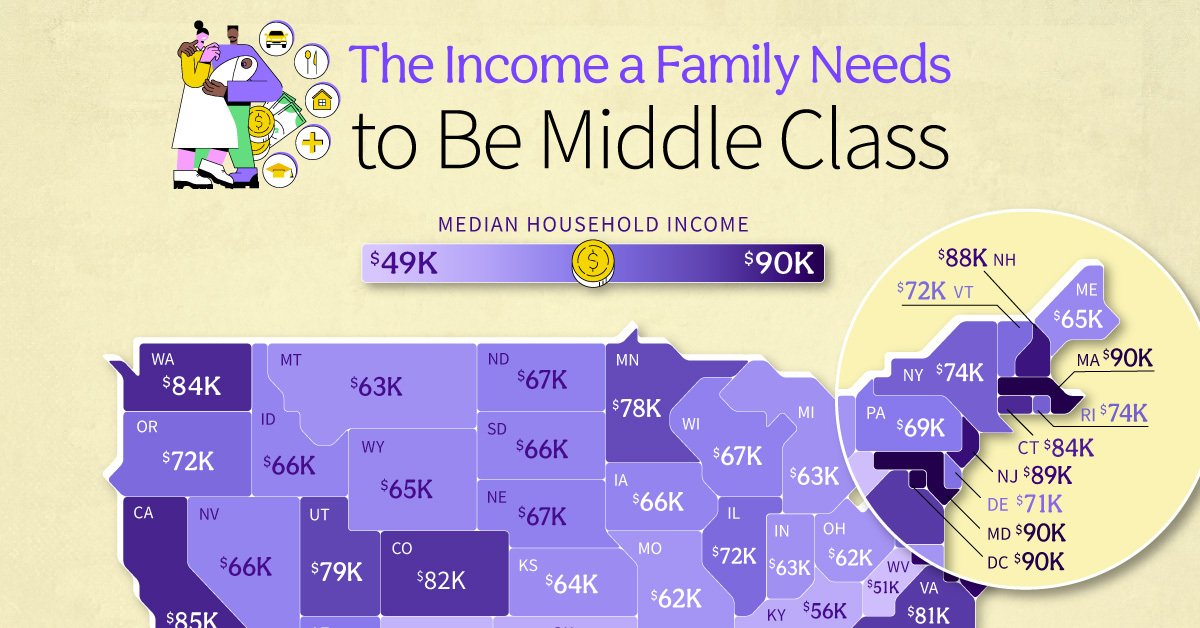
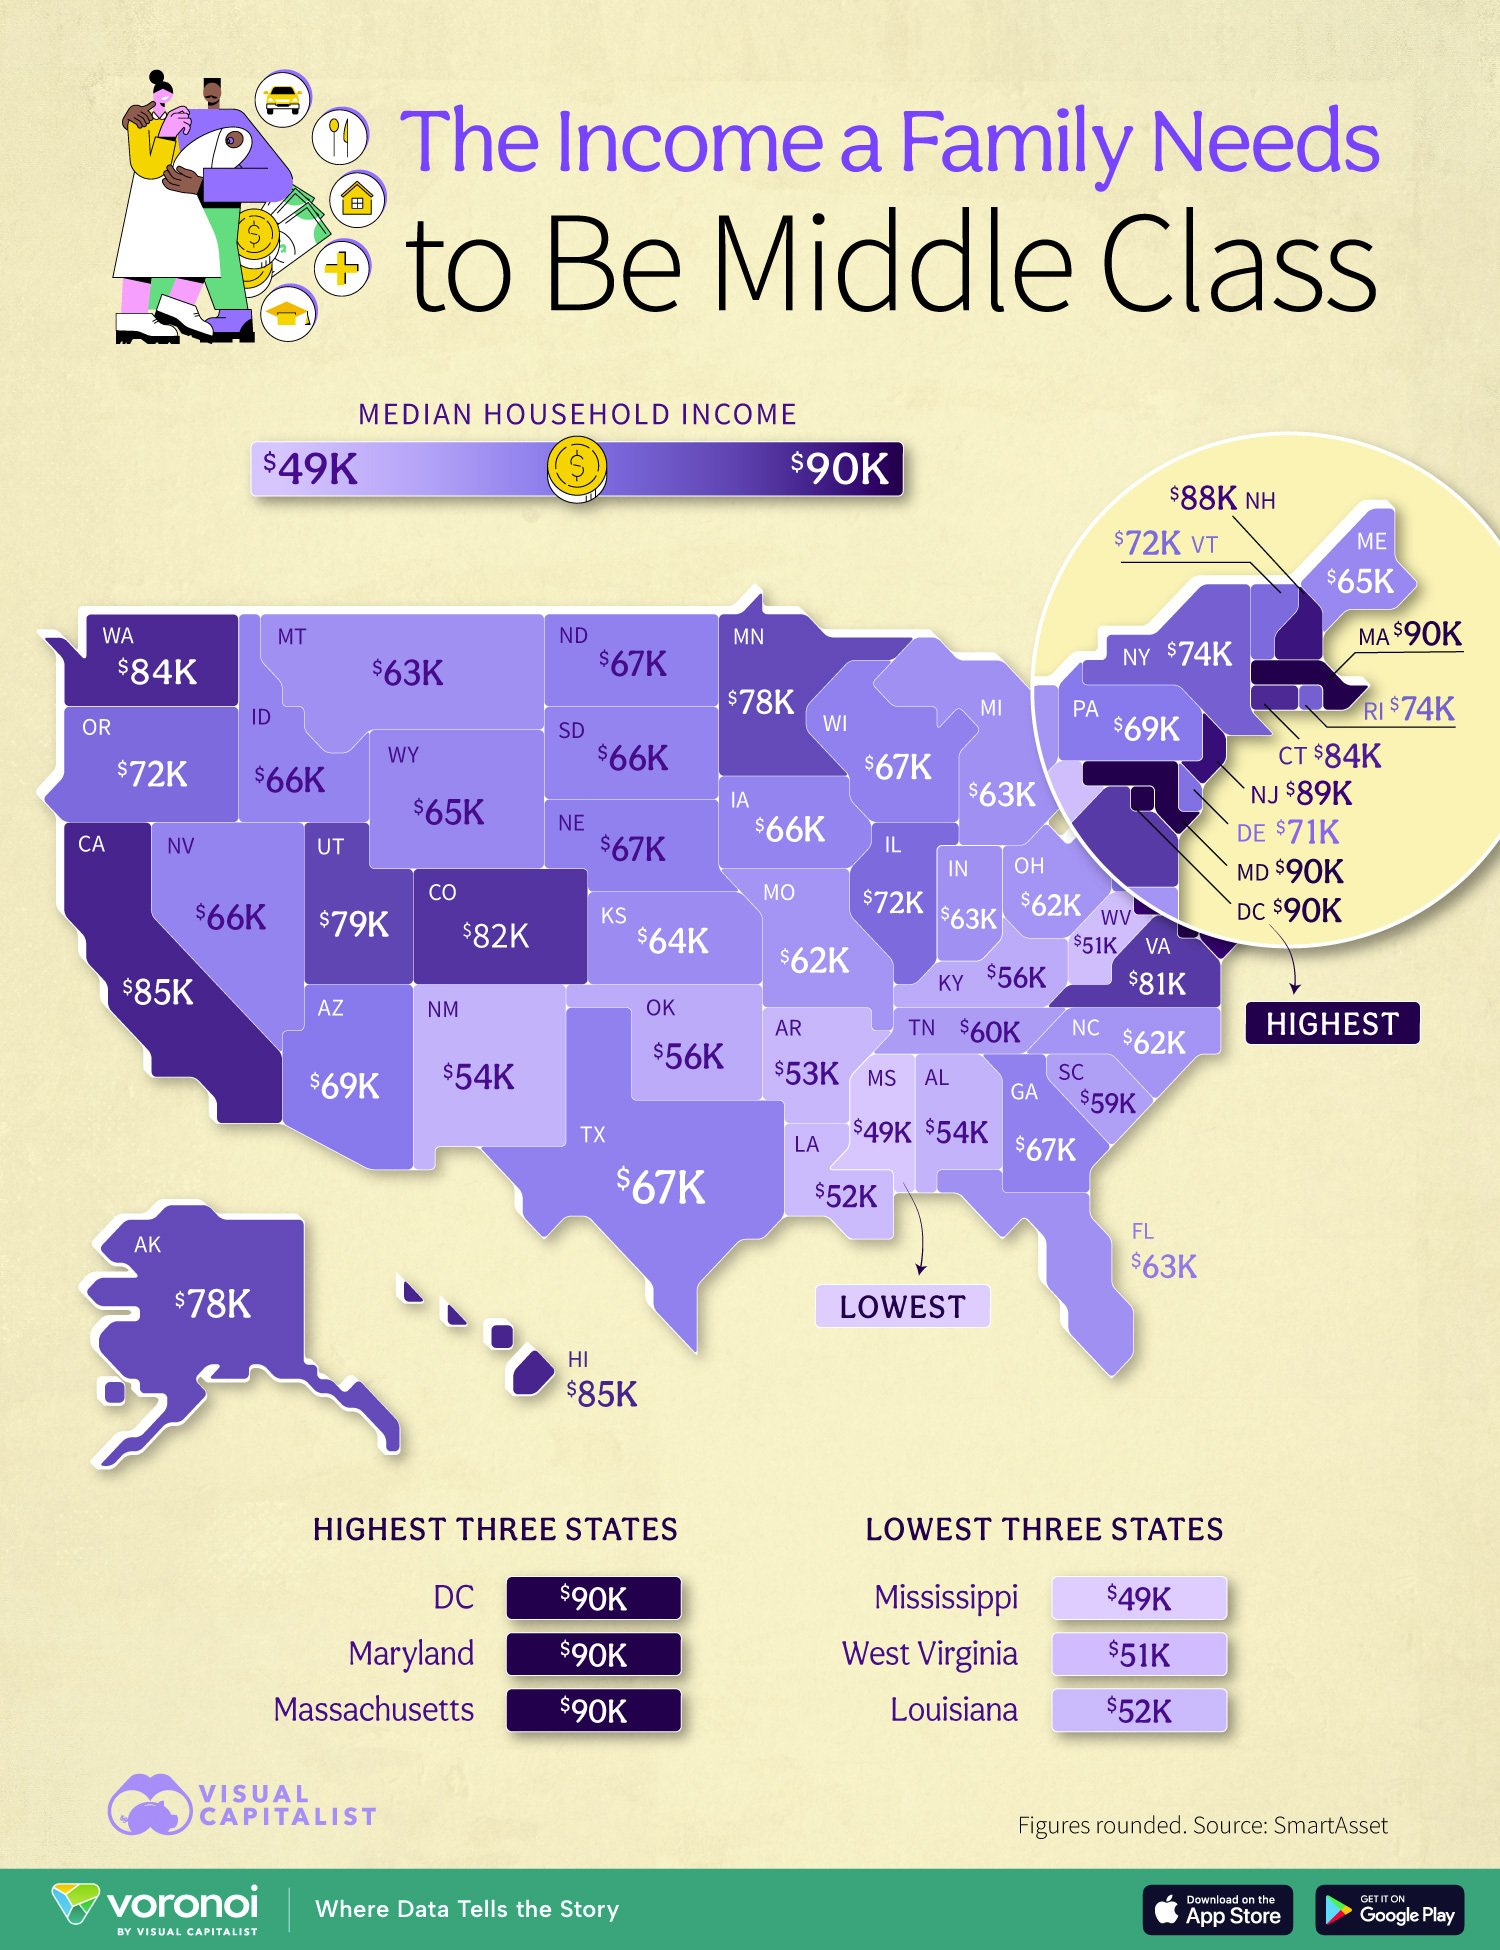
- Maryland, Washington D.C., and Massachusetts have the highest median household income, all above $90,000 annually.
- Mississippi, West Virginia, and Alabama have the lowest median income, all below $54,000 a year.
Across the United States, what qualifies as “middle class” varies widely depending on where you live. This map breaks down the median household income for each U.S. state, revealing sharp contrasts in earning power. It provides a snapshot of where families may feel more or less financially secure based on local income benchmarks.
The data for this visualization comes from SmartAsset.
Editor’s note: This map uses median household income as a simple indicator of the middle class in each state. True middle class status typically spans a range of incomes.
Top Earners Cluster in the Northeast
Maryland, Washington D.C., and Massachusetts lead the nation with household incomes at or above $90,000. High concentrations of federal jobs, tech firms, and elite educational institutions contribute to these numbers. According to Pew Research Center, these regions also report strong access to health care and education, reinforcing higher cost-of-living dynamics.
| Rank | State | Median Household Income |
|---|---|---|
| 1 | Maryland | $90,203 |
| 2 | District Of Columbia | $90,088 |
| 3 | Massachusetts | $89,645 |
| 4 | New Jersey | $89,296 |
| 5 | New Hampshire | $88,465 |
| 6 | Washington | $87,820 |
| 7 | California | $85,388 |
| 8 | Utah | $84,131 |
| 9 | Virginia | $83,848 |
| 10 | Connecticut | $83,771 |
| 11 | Colorado | $82,067 |
| 12 | Alaska | $81,818 |
| 13 | Minnesota | $80,774 |
| 14 | Oregon | $77,305 |
| 15 | Illinois | $76,384 |
| 16 | Hawaii | $76,285 |
| 17 | New York | $74,314 |
| 18 | Georgia | $74,063 |
| 19 | Rhode Island | $74,008 |
| 20 | Wisconsin | $73,014 |
| 21 | Nevada | $72,618 |
| 22 | Pennsylvania | $71,412 |
| 23 | Arizona | $71,033 |
| 24 | Michigan | $69,965 |
| 25 | North Dakota | $69,478 |
| 26 | Texas | $69,430 |
| 27 | North Carolina | $67,671 |
| 28 | Delaware | $67,016 |
| 29 | Iowa | $66,122 |
| 30 | Missouri | $65,795 |
| 31 | South Dakota | $64,956 |
| 32 | Indiana | $64,806 |
| 33 | Florida | $64,666 |
| 34 | Nebraska | $64,573 |
| 35 | Kansas | $64,362 |
| 36 | South Carolina | $63,718 |
| 37 | Ohio | $61,891 |
| 38 | Maine | $61,489 |
| 39 | Montana | $59,955 |
| 40 | Tennessee | $59,862 |
| 41 | Oklahoma | $59,071 |
| 42 | Wyoming | $58,845 |
| 43 | Louisiana | $58,833 |
| 44 | Vermont | $58,654 |
| 45 | Idaho | $58,208 |
| 46 | Alabama | $55,771 |
| 47 | Kentucky | $54,942 |
| 48 | New Mexico | $54,076 |
| 49 | Arkansas | $52,664 |
| 50 | West Virginia | $49,170 |
| 51 | Mississippi | $47,519 |
The South Continues to Lag Behind
Southern states like Mississippi, and Alabama have the lowest median household incomes, under $54,000. Economic mobility in these regions is often hindered by lower investment in public infrastructure and education. As Brookings notes, many Southern states also experience higher poverty rates and limited access to high-paying industries.
States with Growing Incomes
Several states in the West and Midwest—including Oregon, and Utah—are emerging with stronger income levels, typically in the $70,000-$80,000 range.
Learn More on the Voronoi App 
If you enjoyed today’s post, check out U.S. Workers Earning Under $17/Hour by State on Voronoi, the new app from Visual Capitalist.
- Source: https://www.visualcapitalist.com/mapped-the-income-a-family-needs-to-be-middle-class-by-state/