Mapped: The States Where Businesses Use AI Most
See visuals like this from many other data creators on our Voronoi app. Download it for free on iOS or Android and discover incredible data-driven charts from a variety of trusted sources.
Key Takeaways
- Colorado, Arizona, and Washington, D.C. have the highest business AI adoption rates in 2026, while West Virginia ranks last at 10.8%.
- California ranks 13th at 19.5%, above the U.S. average but behind several Western and Sun Belt states.
AI adoption among U.S. businesses is spreading beyond the country’s traditional tech hubs.
In 2026, Colorado and Arizona report the highest shares of businesses using AI, while California ranks 13th nationally. At the other end of the list, West Virginia, Arkansas, and North Dakota have some of the lowest adoption rates.
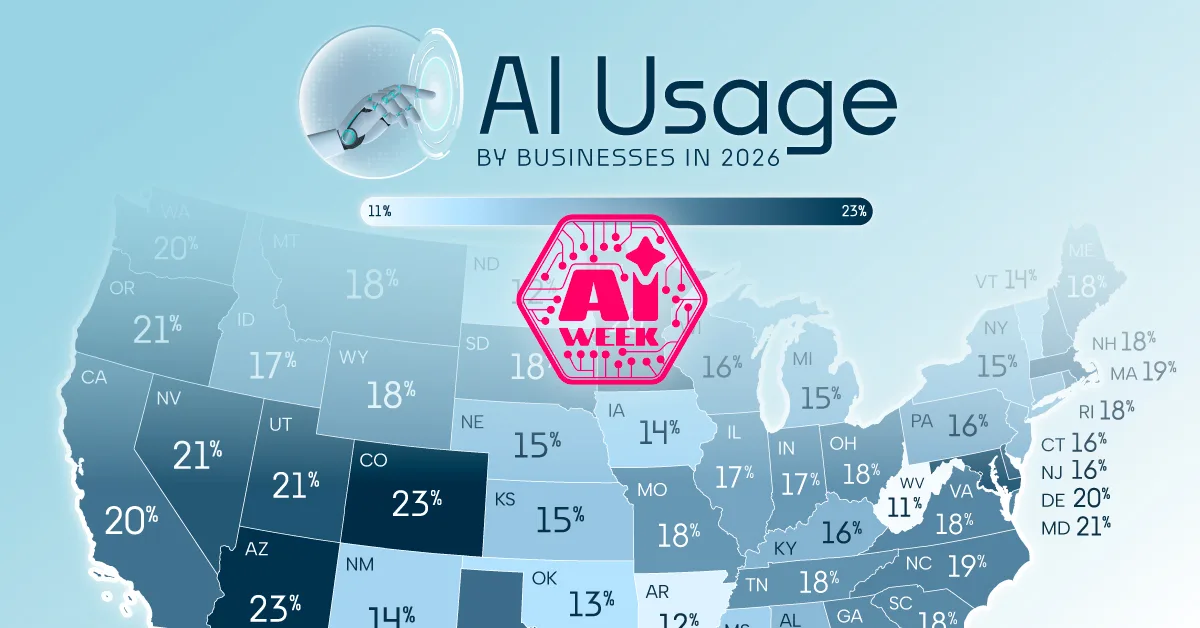
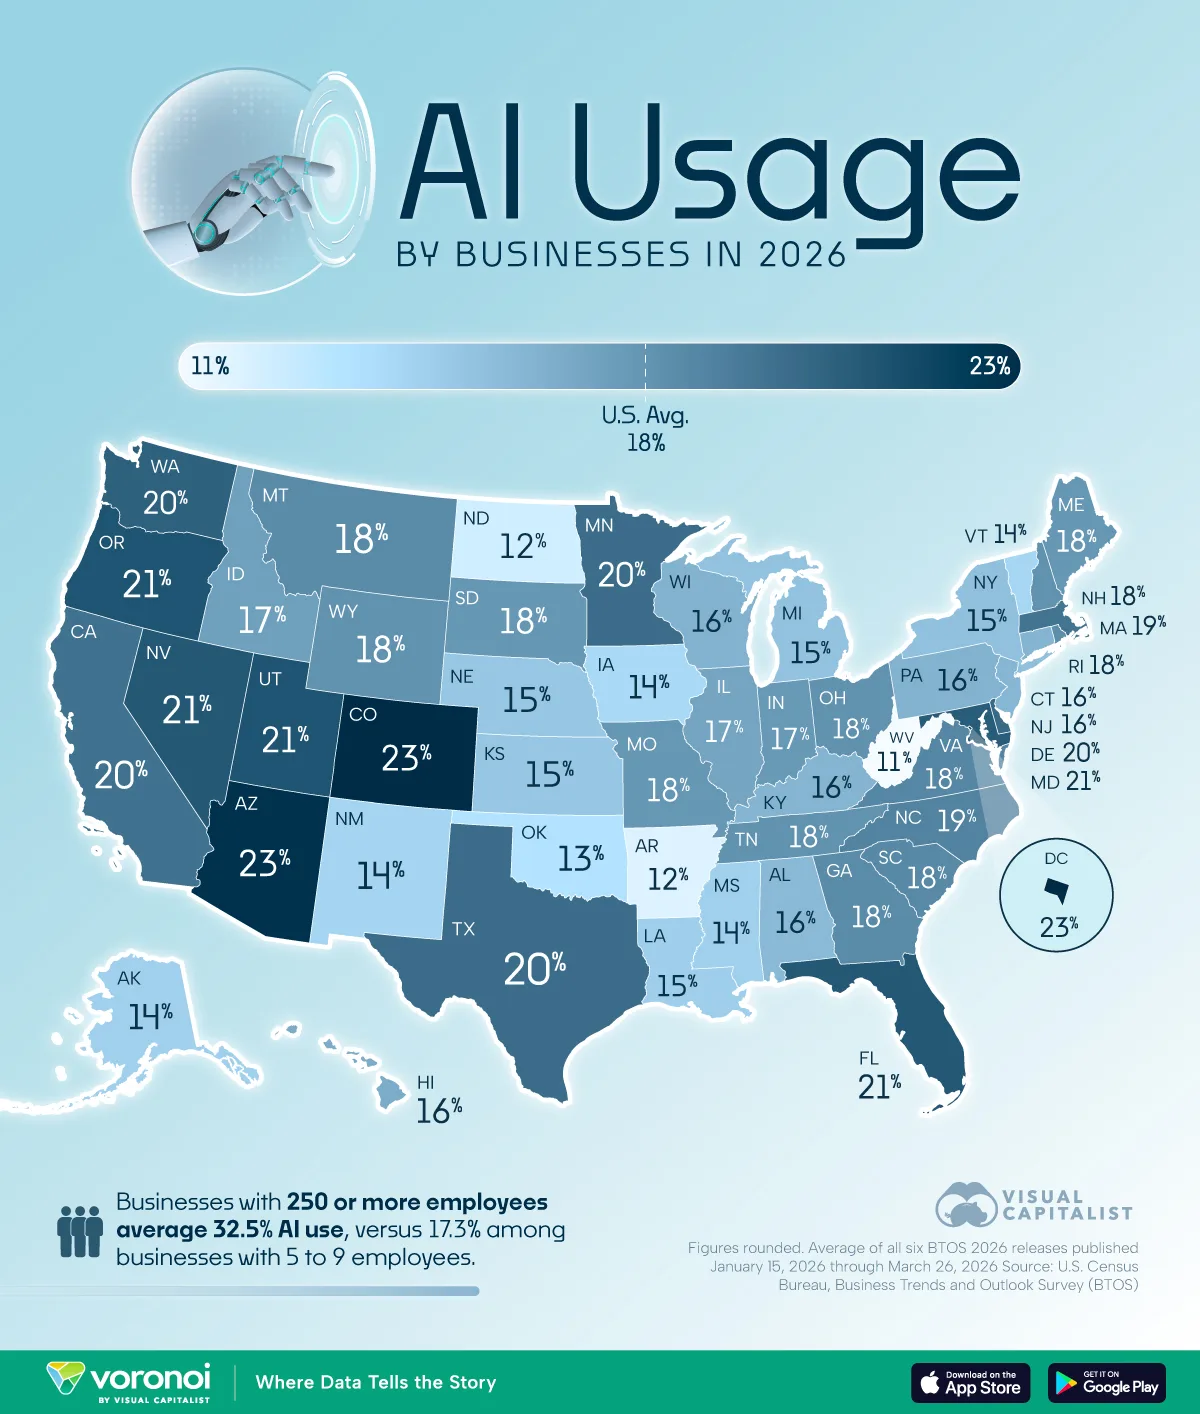
This visualization is part of Visual Capitalist’s AI Week, sponsored by Terzo. It maps AI adoption by businesses by state in 2026 using data from the U.S. Census Bureau’s Business Trends and Outlook Survey (BTOS), averaged across six releases published from January 15, 2026 to March 26, 2026.
Where Business AI Adoption Is Highest in the U.S.
Colorado tops the country with 23.2% of businesses adopting AI on average in 2026. It’s followed closely by Arizona (22.9%) and Washington, D.C. (22.5%), with Oregon and Utah tied for fourth at 21.1%.
The data table below shows the share of businesses by state that are using AI in their workflows in 2026:
| Rank | State or District | Share of businesses reporting AI use in any business function in 2026 |
|---|---|---|
| 1 | Colorado | 23.2% |
| 2 | Arizona | 22.9% |
| 3 | District of Columbia | 22.5% |
| 4 | Oregon | 21.1% |
| 5 | Utah | 21.1% |
| 6 | Nevada | 20.9% |
| 7 | Florida | 20.9% |
| 8 | Maryland | 20.7% |
| 9 | Washington | 20.4% |
| 10 | Delaware | 20.0% |
| 11 | Minnesota | 19.8% |
| 12 | Texas | 19.8% |
| 13 | California | 19.5% |
| 14 | Massachusetts | 19.4% |
| 15 | North Carolina | 18.6% |
| 16 | Virginia | 18.4% |
| 17 | South Carolina | 18.3% |
| 18 | Georgia | 18.2% |
| 19 | Montana | 18.2% |
| 20 | Rhode Island | 18.0% |
| 21 | Wyoming | 17.8% |
| 22 | Ohio | 17.8% |
| 23 | Tennessee | 17.7% |
| 24 | New Hampshire | 17.7% |
| 25 | Maine | 17.5% |
| 26 | Missouri | 17.5% |
| 27 | South Dakota | 17.5% |
| 28 | Indiana | 17.4% |
| 29 | Idaho | 17.0% |
| 30 | Illinois | 16.8% |
| 31 | Hawaii | 16.4% |
| 32 | Wisconsin | 16.1% |
| 33 | Pennsylvania | 16.1% |
| 34 | Connecticut | 16.0% |
| 35 | Kentucky | 16.0% |
| 36 | New Jersey | 15.9% |
| 37 | Alabama | 15.7% |
| 38 | New York | 15.3% |
| 39 | Michigan | 15.2% |
| 40 | Nebraska | 15.0% |
| 41 | Kansas | 15.0% |
| 42 | Louisiana | 14.5% |
| 43 | Alaska | 14.4% |
| 44 | Mississippi | 14.4% |
| 45 | New Mexico | 14.1% |
| 46 | Vermont | 14.0% |
| 47 | Iowa | 13.8% |
| 48 | Oklahoma | 13.3% |
| 49 | North Dakota | 12.3% |
| 50 | Arkansas | 11.8% |
| 51 | West Virginia | 10.8% |
| — |  U.S. Average U.S. Average |
18.2% |
The leaderboard is dominated by Western and Mountain states. Nine states and D.C. report AI use at 20% or above, with most of them west of the Mississippi. California, often assumed to be the AI heartland, ranks 13th at 19.5%—above the national average of 18.2% but still behind the leading states.
A few non-Western standouts appear near the top. Maryland (20.7%) and Delaware (20.0%) benefit from proximity to federal agencies and the mid-Atlantic professional services corridor. Florida (20.9%) and Texas (19.8%) reflect the Sun Belt’s rapid growth in tech employment and startup formation over the past several years.
Where AI Usage Still Lags in America
At the other end of the map, West Virginia trails every state at 10.8%, followed by Arkansas (11.8%), North Dakota (12.3%), Oklahoma (13.3%), and Iowa (13.8%). Vermont (14.0%) and New Mexico (14.1%) round out the bottom seven.
These states share a common profile: smaller average firm sizes, heavier concentrations in agriculture, extraction, and manufacturing, and fewer professional services businesses—the sectors that have driven most AI adoption so far. Vermont is a partial exception, but its small-business-heavy economy tracks with the broader pattern.
Several large-population states also sit below average. New York reports just 15.3% AI use, Michigan 15.2%, and New Jersey 15.9%. Despite dense corporate footprints, their economy-wide averages are pulled down by the long tail of small firms that have been slower to deploy AI tools.
Firm Size Shows a Big Divide in AI Adoption
The state-to-state spread is wide, but the gap between large and small businesses is wider. Businesses with 250 or more employees report 32.5% AI use on average. Businesses with just 5 to 9 employees report 17.3%.
In other words, business size appears to matter even more than geography. The gap between large and small firms is bigger than the gap between the highest-adoption state, Colorado, and the lowest, West Virginia. Larger firms have the IT staff, vendor relationships, and structured workflows that make it easier to pilot and scale AI. Smaller firms face a steeper cost-per-seat and often rely on whatever AI is bundled into the software they already use.
As off-the-shelf AI gets cheaper and more embedded in everyday tools, the size gap is likely to narrow. But as of early 2026, where a business operates matters less for its AI adoption than how big it is.
Learn More on the Voronoi App 
If you enjoyed today’s post, check out which countries lead AI Adoption in Europe on Voronoi.