 See this visualization first on the Voronoi app.
Mapped: The World’s Record Heat Waves
This was originally posted on our Voronoi app. Download the app for free on iOS or Android and discover incredible data-driven charts from a variety of trusted sources.
From South Asia to North America, extreme heat waves are becoming more frequent, intense, and widespread.
In April 2024, temperatures hit 44°C in Jaipur, India, and a scorching 50°C in Shaheed Benazirabad, Pakistan, as a severe heat wave swept across South Asia. Experts now warn that these conditions are fast becoming the new normal in many parts of the world.
According to NASA, there is “unequivocal evidence that Earth is warming at an unprecedented rate.” Supporting this, the Copernicus Earth Observation Program confirmed that July 22, 2024, was the hottest global average daily temperature on record—17.16°C since tracking began in 1940.
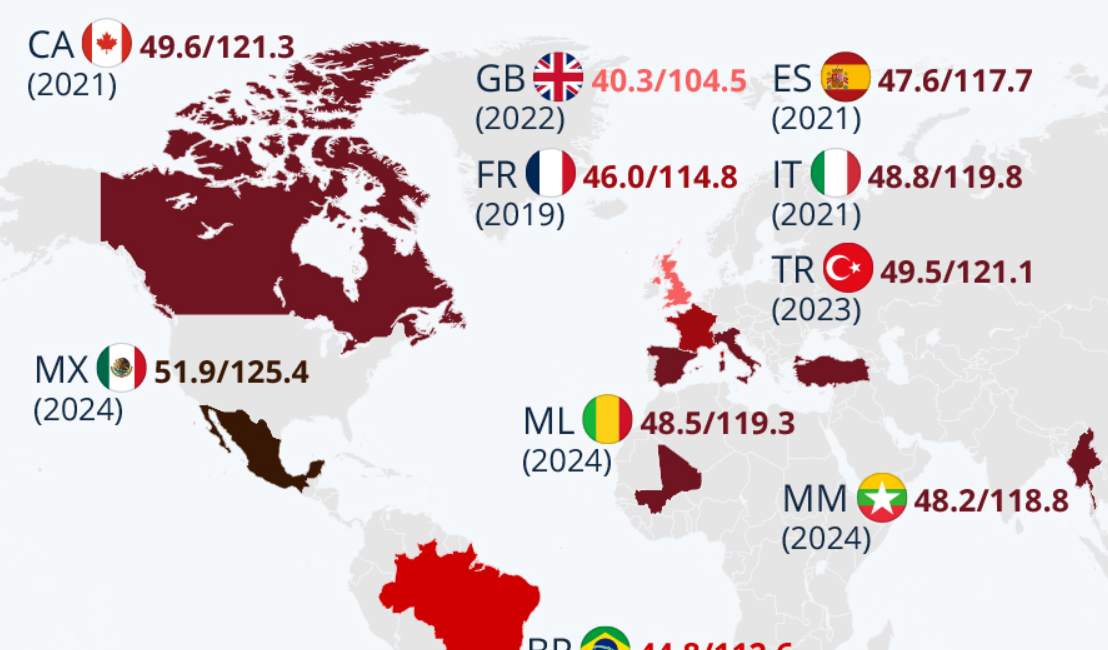
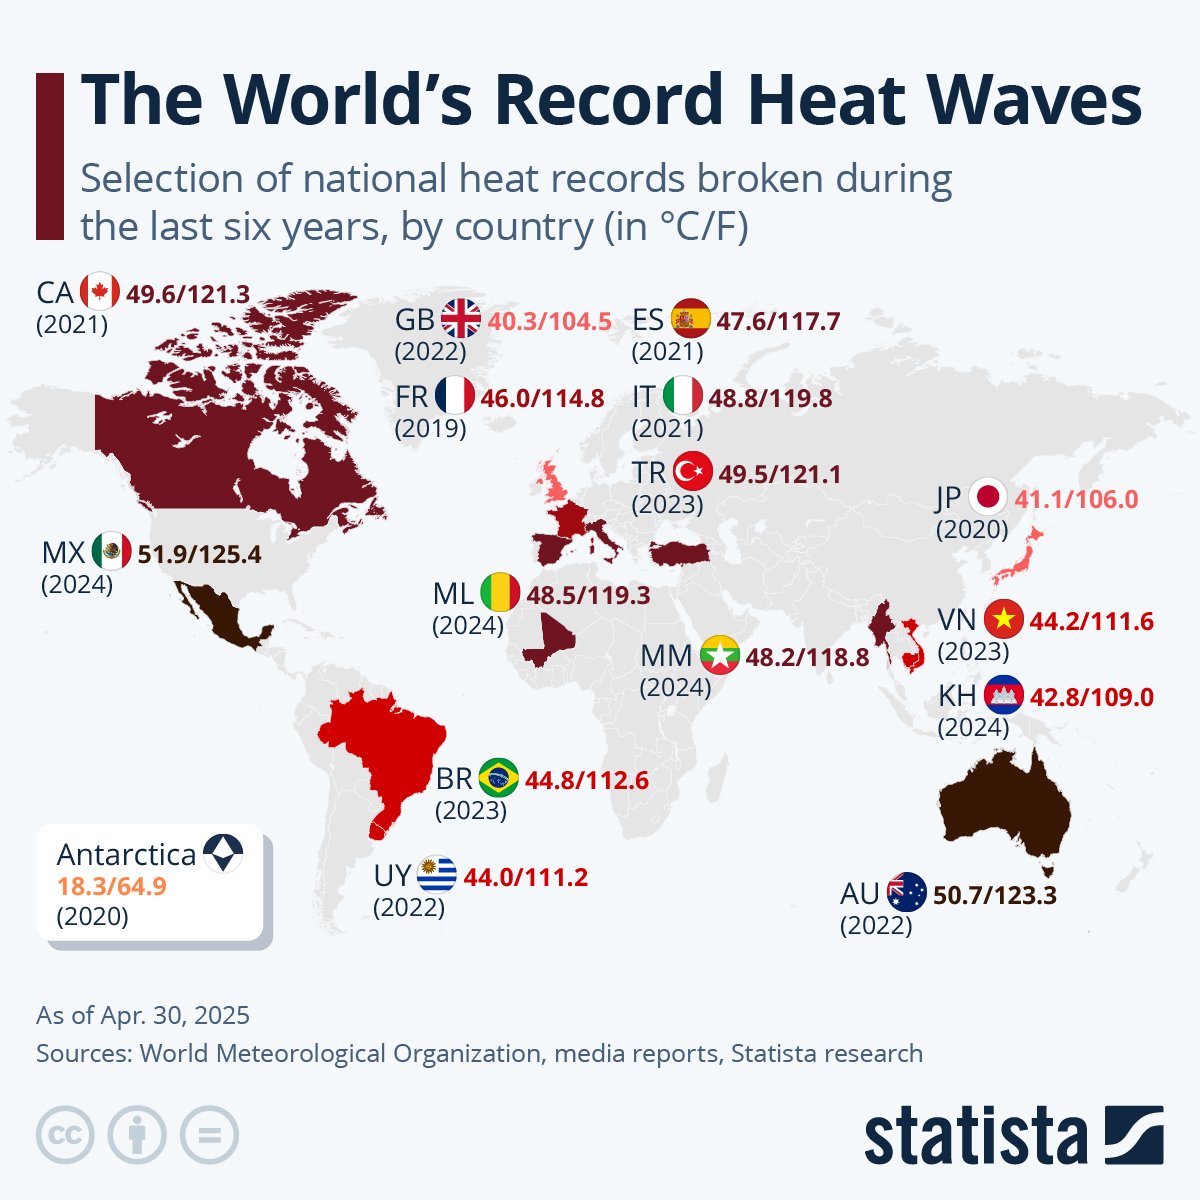
This Statista map highlights a selection of national and continental heat records set over the past six years.
Heat Waves Around the World
At the national level, countries around the world have shattered heat records in just the last six years. For example, Cambodia and Myanmar set new highs in April 2024, with 42.8°C and 48.2°C respectively. In 2022, Australia and Uruguay matched their national records at 50.7°C and 44.0°C, while the UK broke the 40°C barrier for the first time ever.
In 2021, one of the hottest years globally, Canada registered a staggering 49.6°C, marking the third-highest national temperature in the world during this period—remarkable for a country known for its cold climate. That same summer, Italy reported 48.8°C in Syracuse, a European record later confirmed by the World Meteorological Organization.
| Country | Temp (°C) | Temp (°F) | Year |
|---|---|---|---|
 Mexico Mexico |
51.9 | 125.4 | 2024 |
 Australia Australia |
50.7 | 123.3 | 2022 |
 Turkey Turkey |
49.5 | 121.1 | 2023 |
 Canada Canada |
49.6 | 121.3 | 2021 |
 Mali Mali |
48.5 | 119.3 | 2024 |
 Italy Italy |
48.8 | 119.8 | 2021 |
 Myanmar Myanmar |
48.2 | 118.8 | 2024 |
 Spain Spain |
47.6 | 117.7 | 2021 |
 France France |
46.0 | 114.8 | 2019 |
 Vietnam Vietnam |
44.2 | 111.6 | 2023 |
 Brazil Brazil |
44.8 | 112.6 | 2023 |
 Uruguay Uruguay |
44.0 | 111.2 | 2022 |
 Cambodia Cambodia |
42.8 | 109.0 | 2024 |
 Japan Japan |
41.1 | 106.0 | 2020 |
 United Kingdom United Kingdom |
40.3 | 104.5 | 2022 |
 Antarctica Antarctica |
18.3 | 64.9 | 2020 |
Even Antarctica felt the heat: in 2020, the Esperanza Base recorded temperatures above 18°C during the austral summer. And Europe has seen repeated summer heatwaves break long-standing records, from France (46°C in 2019) to Germany (42.6°C) and Belgium (41.8°C).
Despite the growing list of extremes, the highest temperature ever officially recorded remains 56.7°C in California’s Death Valley, set back in 1913.
Learn More on the Voronoi App
If you enjoyed this graphic, make sure to check this chart to see how heat waves in U.S. cities have nearly tripled since the 1960s.