Mapped: Who China Exported to in H1 2025
This was originally posted on our Voronoi app. Download the app for free on iOS or Android and discover incredible data-driven charts from a variety of trusted sources.
Key Takeaways
- Chinese exports to the U.S. fell 10.7% YoY, though analysts have noted that China has been shipping goods through new manufacturing hubs in places like Vietnam and Mexico.
- Exports to Africa grew the most YoY, reflecting China’s continued focus on the region.
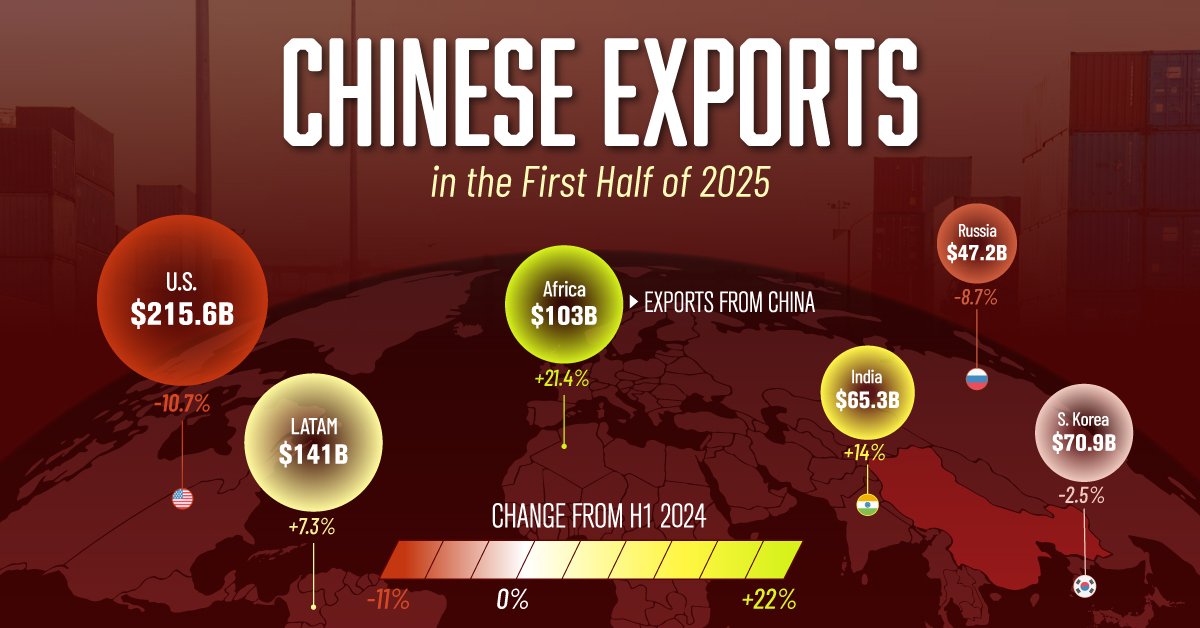
In the first half of 2025, China’s global exports showed shifting trade dynamics. While traditional trade partners like the U.S. and EU remained important, new and growing markets played a more prominent role.
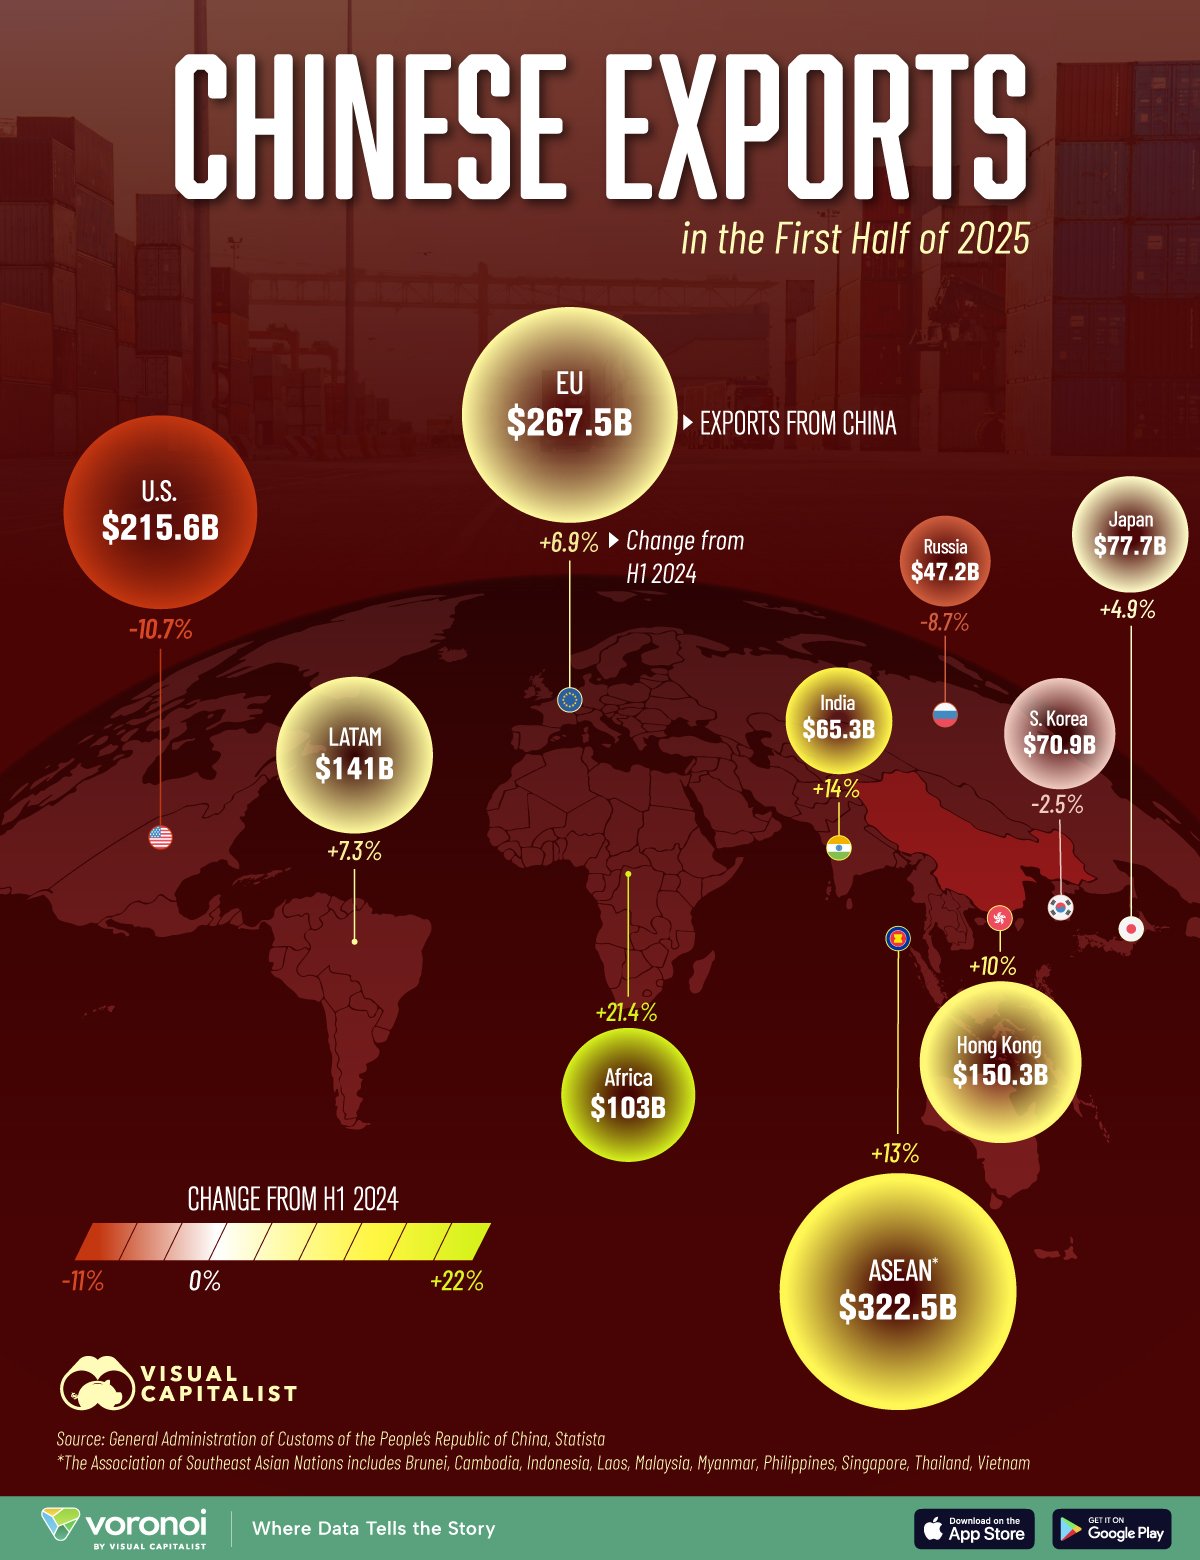
In this infographic, we visualize the top destinations for Chinese exports by dollar value, as well as year-over-year changes from H1 2024.
Data & Discussion
The data for this visualization comes from Statista. It highlights Chinese exports to major countries and regions during the first half of 2025.
| Region | Exports (Billion USD) |
Change from H1 2024 |
|---|---|---|
 Africa Africa |
$103 | 21.4% |
 India India |
$65 | 14.0% |
 ASEAN ASEAN |
$323 | 13.0% |
 Hong Kong Hong Kong |
$150 | 10.0% |
 Latin America Latin America |
$141 | 7.3% |
 EU EU |
$268 | 6.9% |
 Japan Japan |
$78 | 4.9% |
 S. Korea S. Korea |
$71 | -2.5% |
 Russia Russia |
$47 | -8.7% |
 U.S. U.S. |
$216 | -10.7% |
Africa Leads Export Growth
China’s exports to Africa rose to $103 billion, up 21.4% year-over-year. Notably, this was the largest absolute and percentage increase across all countries and/or regions.
It reflects deepening China-Africa economic ties, particularly in mechanical and industrial equipment. As Africa’s consumer base and industrial needs grow, trade with China appears set to expand further.
U.S. Demand Weakens Amid Trade Diversification
Exports to the U.S. declined sharply to $215.6 billion, a drop of 10.7% from H1 2024.
While the U.S. still remains a top destination for Chinese goods, the dip reflects ongoing trade frictions and a trend of companies rerouting supply chains.
Goods often pass through intermediary countries like Vietnam, where final assembly now takes place, partially masking the impact of Chinese manufacturing.
For context, America had a $425 billion trade deficit in Q1 2025, largely driven by machinery, jewelry, electronics, and vehicles.
Learn More on the Voronoi App 
If you enjoyed today’s post, check out America’s Tariff Revenue Surge on Voronoi, the new app from Visual Capitalist.