 See this visualization first on the Voronoi app.
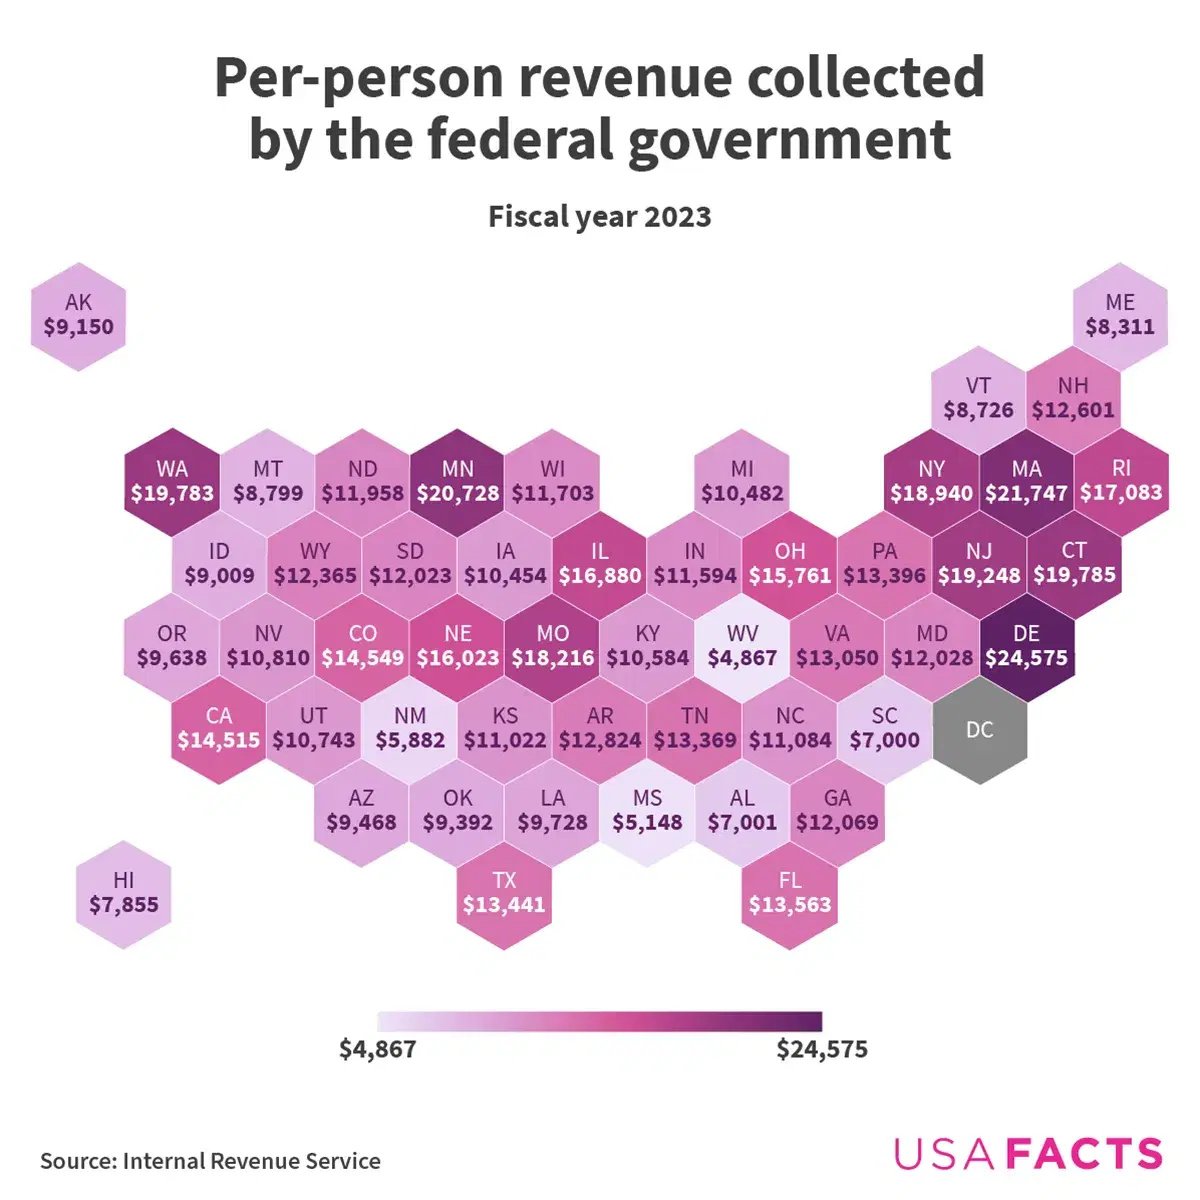
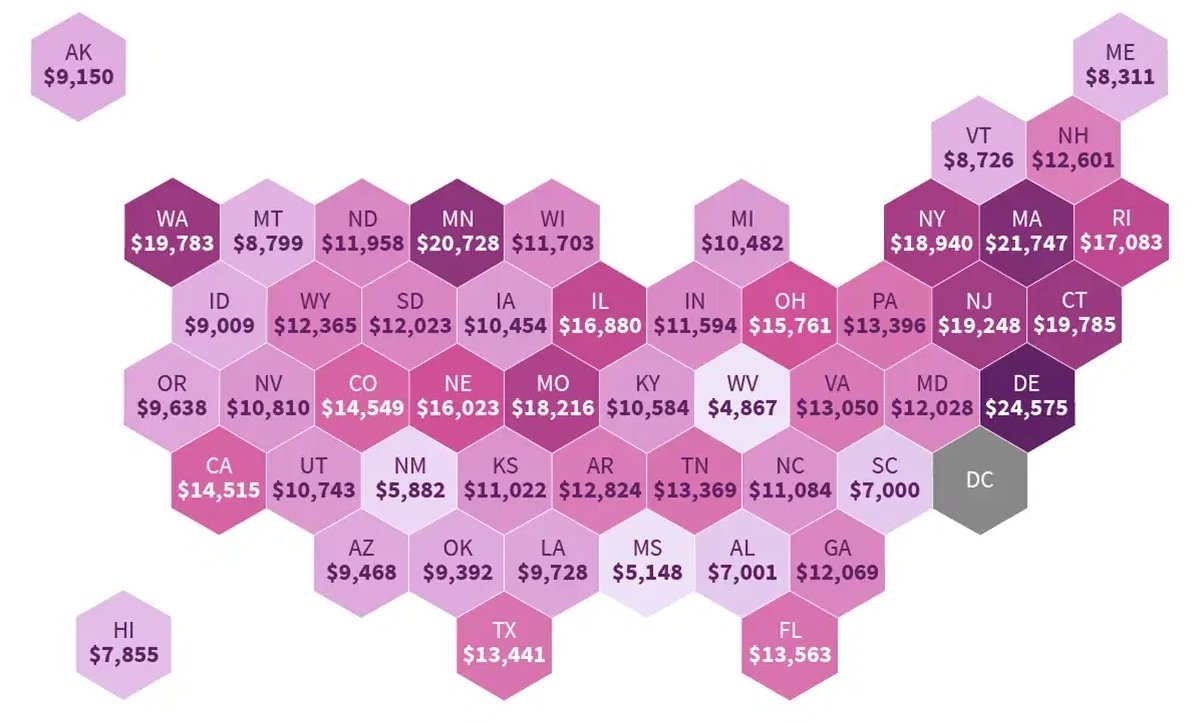
Mapped: U.S. Federal Tax Revenue Per Person, by State
This was originally posted on our Voronoi app. Download the app for free on iOS or Android and discover incredible data-driven charts from a variety of trusted sources.
- Delaware paid the most in federal taxes per person in 2023: $24,575 per resident.
- Washington, DC, contributed an outsized $54,612 per person—more than double any U.S. state.
- West Virginia, Mississippi, and New Mexico paid the least per capita, each under $6,000.
In 2023, the U.S. federal government collected $4.67 trillion in taxes and redistributed $4.56 trillion back to states and residents. But which states contributed the most—and least—on a per-person basis?
This dataset, originally published by USAFacts, shows how much federal revenue each state generated per capita.
| Rank | State | Federal tax revenue per capita (FY 2023) |
|---|---|---|
| 1 | Delaware | $24,575 |
| 2 | Massachusetts | $21,747 |
| 3 | Minnesota | $20,728 |
| 4 | Connecticut | $19,785 |
| 5 | Washington | $19,783 |
| 6 | New Jersey | $19,248 |
| 7 | New York | $18,940 |
| 8 | Missouri | $18,216 |
| 9 | Rhode Island | $17,083 |
| 10 | Illinois | $16,880 |
| 11 | Nebraska | $16,023 |
| 12 | Ohio | $15,761 |
| 13 | Colorado | $14,549 |
| 14 | California | $14,515 |
| 15 | Florida | $13,563 |
| 16 | Texas | $13,441 |
| 17 | Pennsylvania | $13,396 |
| 18 | Tennessee | $13,369 |
| 19 | Virginia | $13,050 |
| 20 | Arkansas | $12,824 |
| 21 | New Hampshire | $12,601 |
| 22 | Wyoming | $12,365 |
| 23 | Georgia | $12,069 |
| 24 | Maryland | $12,028 |
| 25 | South Dakota | $12,023 |
| 26 | North Dakota | $11,958 |
| 27 | Wisconsin | $11,703 |
| 28 | Indiana | $11,594 |
| 29 | North Carolina | $11,084 |
| 30 | Kansas | $11,022 |
| 31 | Nevada | $10,810 |
| 32 | Utah | $10,743 |
| 33 | Kentucky | $10,584 |
| 34 | Michigan | $10,482 |
| 35 | Iowa | $10,454 |
| 36 | Louisiana | $9,728 |
| 37 | Oregon | $9,638 |
| 38 | Arizona | $9,468 |
| 39 | Oklahoma | $9,392 |
| 40 | Alaska | $9,150 |
| 41 | Idaho | $9,009 |
| 42 | Montana | $8,799 |
| 43 | Vermont | $8,726 |
| 44 | Maine | $8,311 |
| 45 | Hawaii | $7,855 |
| 46 | Alabama | $7,001 |
| 47 | South Carolina | $7,000 |
| 48 | New Mexico | $5,882 |
| 49 | Mississippi | $5,148 |
| 50 | West Virginia | $4,867 |
Delaware led all states with $24,575 in federal taxes paid per resident, driven by high levels of business incorporation. Massachusetts ($21,747) and Minnesota ($20,728) followed, thanks to high average incomes. Meanwhile, the lowest contributors per person were West Virginia ($4,867), Mississippi ($5,148), and New Mexico ($5,882).
The Population-Revenue Disconnect
While California, Texas, New York, and Florida are the top contributors in absolute terms, collectively making up more than a third of all U.S. federal revenue, the per capita view tells a different story.
Smaller states with wealthy or business-friendly profiles, like Connecticut and New Jersey, rank much higher in per-person contributions.
Washington, D.C., is an outlier, contributing $54,612 per resident. That’s more than twice the amount of the top state. This is largely due to the city’s dense concentration of high-income earners and government-affiliated economic activity.
Do States Get Back What They Pay In?
Not all federal dollars stay in Washington. Most are returned to residents and states through entitlement programs like Social Security and Medicaid, as well as infrastructure, education, and defense.
However, some states get more than they give. In 2023, 19 states were net contributors—sending more to the federal government than they received. New York tops that list with a $89 billion net outflow. Conversely, Virginia received about $79 billion more than it paid in, largely due to defense spending.
Learn More on the Voronoi App
Explore how federal money moves over time in our recommended Voronoi post: U.S. Federal Government Finances Over Time.