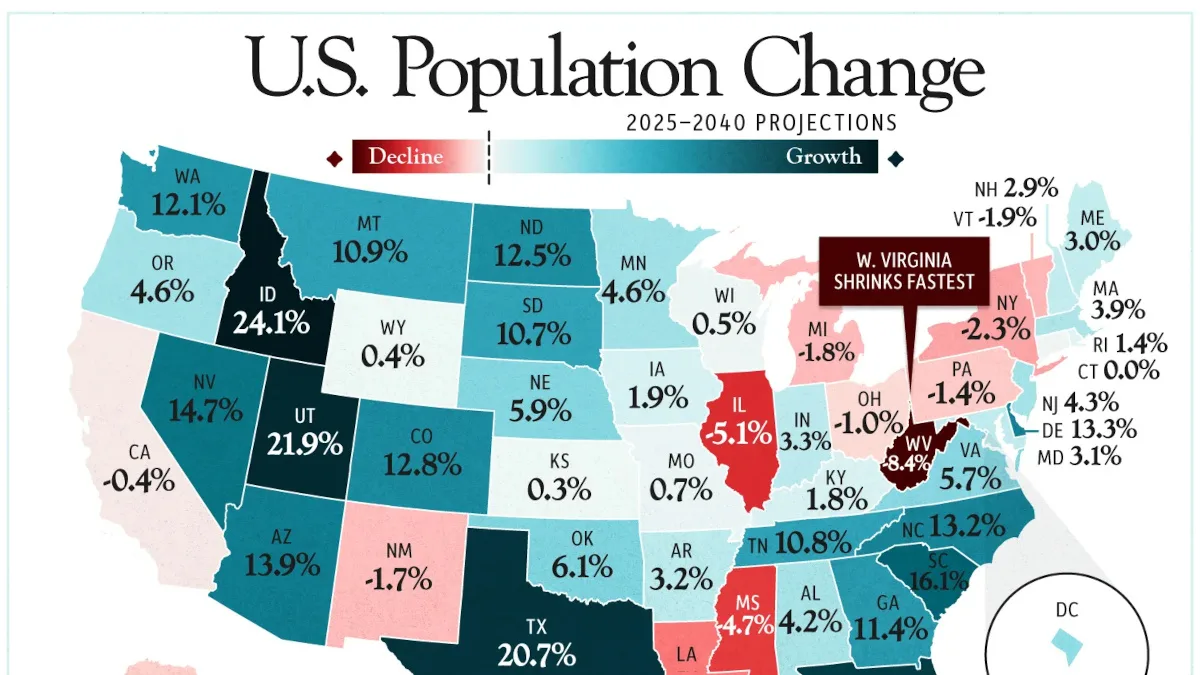
Mapped: U.S. Population Change by State Through 2040
Key Takeaways:
- 14 states are projected to have smaller populations in 2040 than in 2025.
- Idaho (+24.1%) and Utah (+21.9%) are projected to see the fastest percentage growth.
- The South accounts for roughly 78% of projected U.S. population gains through 2040.
The U.S. population is projected to add roughly 21.5 million people between 2025 and 2040, an increase of 6.3%.
This visualization maps projected state-level population change over the period using projections from the Weldon Cooper Center for Public Service at the University of Virginia, benchmarked to the 2020 Census and 2025 Census Bureau population estimates.
Where America’s Population Is Growing Fastest
The table below shows projected population changes for all 50 states and Washington, D.C., through 2040, based on the Cooper Center projections.
| Ranking | State or District | Population Change | Percentage Change |
|---|---|---|---|
| 1 | Idaho | 488,619 | 24.1% |
| 2 | Utah | 773,467 | 21.9% |
| 3 | Texas | 6,559,670 | 20.7% |
| 4 | Florida | 4,621,619 | 19.7% |
| 5 | South Carolina | 894,828 | 16.1% |
| 6 | Nevada | 482,692 | 14.7% |
| 7 | Arizona | 1,057,832 | 13.9% |
| 8 | Delaware | 141,134 | 13.3% |
| 9 | North Carolina | 1,477,227 | 13.2% |
| 10 | Colorado | 768,298 | 12.8% |
| 11 | North Dakota | 99,521 | 12.5% |
| 12 | Washington | 968,101 | 12.1% |
| 13 | Georgia | 1,284,018 | 11.4% |
| 14 | Montana | 124,693 | 10.9% |
| 15 | Tennessee | 791,952 | 10.8% |
| 16 | South Dakota | 100,460 | 10.7% |
| 17 | District of Columbia | 44,977 | 6.5% |
| 18 | Oklahoma | 250,585 | 6.1% |
| 19 | Nebraska | 119,582 | 5.9% |
| 20 | Virginia | 506,905 | 5.7% |
| 21 | Minnesota | 270,623 | 4.6% |
| 22 | Oregon | 196,194 | 4.6% |
| 23 | New Jersey | 409,893 | 4.3% |
| 24 | Alabama | 219,790 | 4.2% |
| 25 | Massachusetts | 278,669 | 3.9% |
| 26 | Indiana | 232,269 | 3.3% |
| 27 | Arkansas | 100,277 | 3.2% |
| 28 | Maryland | 192,484 | 3.1% |
| 29 | Maine | 42,213 | 3.0% |
| 30 | New Hampshire | 41,632 | 2.9% |
| 31 | Iowa | 63,007 | 1.9% |
| 32 | Kentucky | 84,811 | 1.8% |
| 33 | Rhode Island | 15,656 | 1.4% |
| 34 | Missouri | 45,267 | 0.7% |
| 35 | Wisconsin | 29,048 | 0.5% |
| 36 | Wyoming | 2,198 | 0.4% |
| 37 | Kansas | 8,769 | 0.3% |
| 38 | Connecticut | -396 | 0.0% |
| 39 | California | -144,900 | -0.4% |
| 40 | Ohio | -122,089 | -1.0% |
| 41 | Alaska | -8,841 | -1.2% |
| 42 | Hawaii | -20,429 | -1.4% |
| 43 | Pennsylvania | -184,685 | -1.4% |
| 44 | New Mexico | -36,278 | -1.7% |
| 45 | Michigan | -183,820 | -1.8% |
| 46 | Vermont | -12,213 | -1.9% |
| 47 | New York | -456,879 | -2.3% |
| 48 | Louisiana | -153,837 | -3.3% |
| 49 | Mississippi | -138,951 | -4.7% |
| 50 | Illinois | -649,689 | -5.1% |
| 51 | West Virginia | -147,952 | -8.4% |
| — |  United States United States |
21,528,019 | 6.3% |
Texas stands out in absolute terms, adding nearly 6.6 million residents, while Idaho leads by percentage at 24.1%. At the other end, West Virginia is projected to experience the steepest percentage decline at -8.4%.
Texas and Florida alone are projected to add about 11.2 million residents, accounting for more than half of total U.S. population growth through 2040. North Carolina (+1.48M) and Georgia (+1.28M) follow, helping the South capture roughly 78% of the nation’s projected gains.
The projections extend a decades-long shift toward the Sun Belt. Looking back at population growth since 1970 shows how dramatically the country’s population center has moved south and west.
14 States Are Projected to Lose Population
While the country overall grows, 14 states are projected to have fewer residents in 2040 than in 2025. Illinois is expected to record the largest absolute decline at roughly 650,000 people, followed by New York at 457,000.
West Virginia is projected to see the steepest percentage decline at 8.4%, followed by Mississippi at 4.7% and Louisiana at 3.3%. Connecticut, by contrast, remains essentially flat.
The Northeast and Midwest combined account for barely 1% of projected U.S. population growth. At the national level, slower natural growth could add further pressure: the U.S. fertility rate fell to a record low in 2025.
A Slower-Growing America
The Cooper Center emphasizes that population projections are scenarios rather than precise forecasts. Migration, fertility, and mortality trends can shift, changing the outlook substantially before 2040.
Beyond the U.S., demographic trajectories are diverging sharply. Some of the world’s fastest-growing countries are expanding rapidly even as aging economies face much slower population growth.
Learn More on the Voronoi App
To explore how aging is reshaping major economies, see Senior Populations of the World’s Largest Economies on the Voronoi app.