How Senate Representation Varies Across America
Key Takeaways
- California has more residents than the 21 least-populous states combined, yet those states collectively hold 42 Senate seats compared with California’s two.
- Nine states contain more than half the population of the 50 states but hold just 18 of the Senate’s 100 seats.
- Senate representation also affects presidential elections, with every state receiving two Electoral College votes tied to its Senate seats.
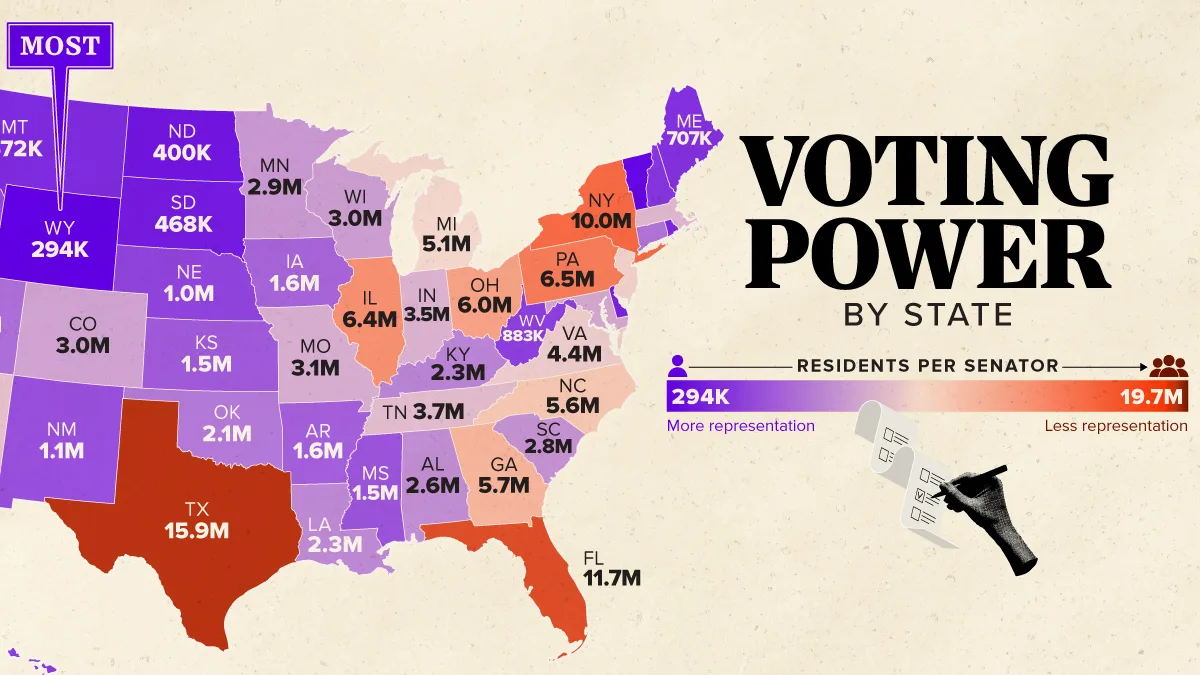
Despite having nearly 67 times as many residents, California and Wyoming each have two seats in the U.S. Senate.
This means each California senator represents approximately 19.7 million people, compared with just 294,000 in Wyoming. The contrast illustrates how Senate representation per resident varies across the country.
This visualization uses July 2025 population estimates from the U.S. Census Bureau to compare Senate representation across all 50 states. Residents per senator is calculated by dividing each state’s population by two.
Where Americans Have the Most Senate Representation
The table below ranks states by the number of residents represented by each U.S. senator, from the smallest populations per senator to the largest.
| Rank | State | Population | Population Per Sentor |
|---|---|---|---|
| 1 | Wyoming | 588,753 | 294,377 |
| 2 | Vermont | 644,663 | 322,332 |
| 3 | District of Columbia | 693,645 | 346,823 |
| 4 | Alaska | 737,270 | 368,635 |
| 5 | North Dakota | 799,358 | 399,679 |
| 6 | South Dakota | 935,094 | 467,547 |
| 7 | Delaware | 1,059,952 | 529,976 |
| 8 | Rhode Island | 1,114,521 | 557,261 |
| 9 | Montana | 1,144,694 | 572,347 |
| 10 | Maine | 1,414,874 | 707,437 |
| 11 | New Hampshire | 1,415,342 | 707,671 |
| 12 | Hawaii | 1,432,820 | 716,410 |
| 13 | West Virginia | 1,766,147 | 883,074 |
| 14 | Nebraska | 2,018,006 | 1,009,003 |
| 15 | Idaho | 2,029,733 | 1,014,867 |
| 16 | New Mexico | 2,125,498 | 1,062,749 |
| 17 | Mississippi | 2,954,160 | 1,477,080 |
| 18 | Kansas | 2,977,220 | 1,488,610 |
| 19 | Arkansas | 3,114,791 | 1,557,396 |
| 20 | Iowa | 3,238,387 | 1,619,194 |
| 21 | Nevada | 3,282,188 | 1,641,094 |
| 22 | Utah | 3,538,904 | 1,769,452 |
| 23 | Connecticut | 3,688,496 | 1,844,248 |
| 24 | Oklahoma | 4,123,288 | 2,061,644 |
| 25 | Oregon | 4,273,586 | 2,136,793 |
| 26 | Kentucky | 4,606,864 | 2,303,432 |
| 27 | Louisiana | 4,618,189 | 2,309,095 |
| 28 | Alabama | 5,193,088 | 2,596,544 |
| 29 | South Carolina | 5,570,274 | 2,785,137 |
| 30 | Minnesota | 5,830,405 | 2,915,203 |
| 31 | Wisconsin | 5,972,787 | 2,986,394 |
| 32 | Colorado | 6,012,561 | 3,006,281 |
| 33 | Maryland | 6,265,347 | 3,132,674 |
| 34 | Missouri | 6,270,541 | 3,135,271 |
| 35 | Indiana | 6,973,333 | 3,486,667 |
| 36 | Massachusetts | 7,154,084 | 3,577,042 |
| 37 | Tennessee | 7,315,076 | 3,657,538 |
| 38 | Arizona | 7,623,818 | 3,811,909 |
| 39 | Washington | 8,001,020 | 4,000,510 |
| 40 | Virginia | 8,880,107 | 4,440,054 |
| 41 | New Jersey | 9,548,215 | 4,774,108 |
| 42 | Michigan | 10,127,884 | 5,063,942 |
| 43 | North Carolina | 11,197,968 | 5,598,984 |
| 44 | Georgia | 11,302,748 | 5,651,374 |
| 45 | Ohio | 11,900,510 | 5,950,255 |
| 46 | Illinois | 12,719,141 | 6,359,571 |
| 47 | Pennsylvania | 13,059,432 | 6,529,716 |
| 48 | New York | 20,002,427 | 10,001,214 |
| 49 | Florida | 23,462,518 | 11,731,259 |
| 50 | Texas | 31,709,821 | 15,854,911 |
| 51 | California | 39,355,309 | 19,677,655 |
Wyoming has the fewest residents per senator, at approximately 294,000. Vermont follows with about 322,000 residents per senator, while Alaska has 369,000 and North Dakota has 400,000.
At the opposite end, California has the most residents per senator, at nearly 19.7 million. Texas follows with 15.9 million, Florida with 11.7 million, and New York with approximately 10 million.
Nine States, Half the Population, 18 Senate Seats
California, Texas, Florida, New York, Pennsylvania, Illinois, Ohio, Georgia, and North Carolina are home to more than half the population of the 50 states, according to July 2025 estimates.
Together, these nine states hold just 18 Senate seats, while the other 41 states hold the remaining 82. This reflects the Senate’s equal-state representation system, which gives every state two seats regardless of population.
The map also highlights Washington, D.C., which has no voting senators despite having nearly 694,000 residents. Unlike the 50 states, the district is not included in the residents-per-senator comparison.
Why Does Every State Have Two Senators?
The arrangement dates back to the Constitutional Convention of 1787, when delegates disagreed over how states should be represented in the federal government.
The resulting Great Compromise established population-based representation in the House of Representatives and equal representation for states in the Senate.
Originally, senators were chosen by state legislatures. The 17th Amendment, ratified in 1913, introduced direct elections for senators but left the two-senator rule unchanged.
What Does This Mean for Voting Power?
Every U.S. senator has one vote on legislation, federal appointments, and other Senate decisions, regardless of the population of the state they represent.
As a result, senators from less-populous states collectively represent fewer residents per seat than those from larger states. The House of Representatives operates differently, with seats apportioned according to state populations.
Senate representation also plays a role in presidential elections. Each state’s Electoral College allocation includes two votes corresponding to its Senate seats, plus additional votes based on its representation in the House. Our map of Electoral College votes by state shows how these allocations differ across the country.
Learn More on the Voronoi App
If you enjoyed this visualization, check out Top 15 Ranked: America’s Reddest and Bluest Cities Based on County on the Voronoi app.