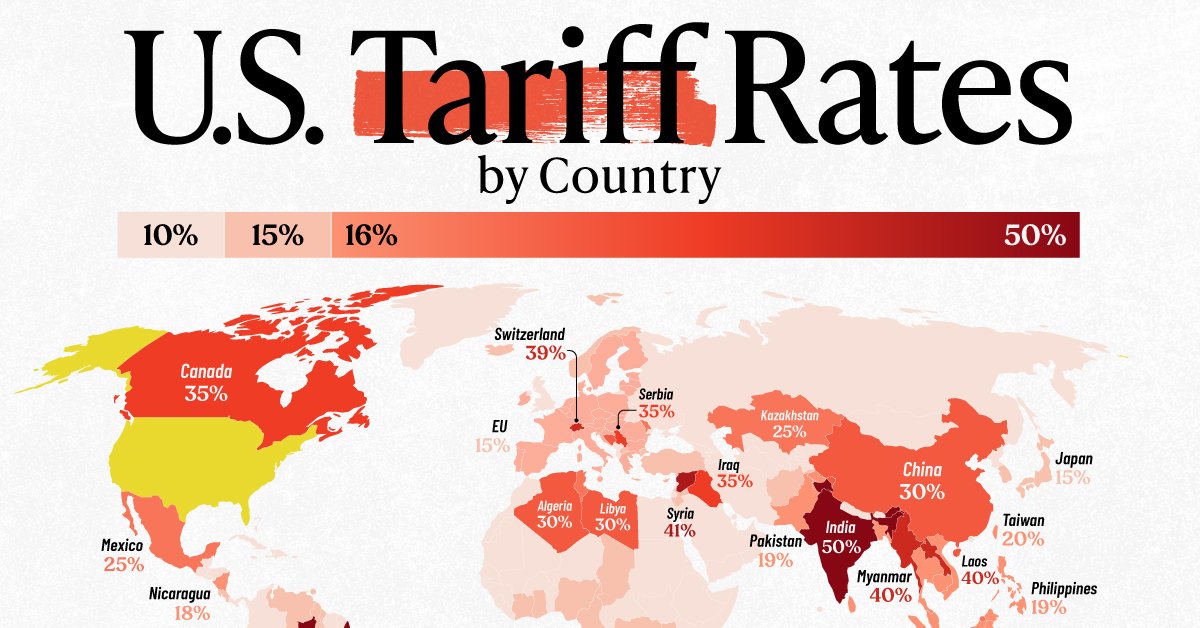
Mapped: U.S. Tariff Rates by Country
This was originally posted on our Voronoi app. Download the app for free on iOS or Android and discover incredible data-driven charts from a variety of trusted sources.
Key Takeaways
- The Trump administration increased tariffs, citing trade deficits and national security concerns.
- Brazil and India received the highest tariff rate of 50%.
Under the second Trump administration, new tariff levels have been applied to over 80 countries, with rates ranging from 10% to 50%. The U.S. President argues that persistent trade deficits and unfair foreign trade barriers harm American industries and threaten national security, even in cases where the U.S. runs a trade surplus with some of these countries.
This infographic visualizes the new tariff landscape, highlighting how different trading partners are affected. The data for this visualization comes from CNN and the White House.
High Tariffs, Even on Surplus Partners
India and Brazil both received the highest tariff rate of 50%. Despite the U.S. running a $7 billion goods surplus with Brazil in 2024, it received the steepest rate. In addition to claims that trade with Brazil has been unfair to the United States, Trump has used tariffs to pressure Brazil’s judiciary over a criminal case involving former President Jair Bolsonaro, which the Republican has called a “political execution.”
Similarly, on August 26, 50% tariffs took effect against India as a penalty for its purchases of Russian oil and weapons.
Meanwhile, other major trade partners with large U.S. deficits saw relatively moderate tariffs. For instance, Vietnam ($123 billion deficit), Taiwan ($74 billion), and Japan ($69 billion) were all placed in the 15–20% range. The European Union received a 15% tariff on most goods, despite a massive $236 billion deficit.
| Trading partner | Tariff rate | Trade balance, 2024 |
|---|---|---|
 Brazil Brazil |
50% | +$7B |
 India India |
50% | −$46B |
 Syria Syria |
41% | −$0.009B |
 Laos Laos |
40% | −$0.763B |
 Myanmar Myanmar |
40% | −$0.577B |
 Switzerland Switzerland |
39% | −$38B |
 Canada Canada |
35% | −$62B |
 Iraq Iraq |
35% | −$6B |
 Serbia Serbia |
35% | −$0.604B |
 Algeria Algeria |
30% | −$1B |
 Bosnia and Herzegovina Bosnia and Herzegovina |
30% | −$0.126B |
 China China |
30% | −$295B |
 Libya Libya |
30% | −$0.9B |
 South Africa South Africa |
30% | −$9B |
 Mexico Mexico |
25% | −$171.5B |
 Brunei Brunei |
25% | −$0.111B |
 Kazakhstan Kazakhstan |
25% | −$1B |
 Moldova Moldova |
25% | −$0.085B |
 Tunisia Tunisia |
25% | −$0.622B |
 Bangladesh Bangladesh |
20% | −$6B |
 Sri Lanka Sri Lanka |
20% | −$3B |
 Taiwan Taiwan |
20% | −$74B |
 Vietnam Vietnam |
20% | −$123B |
 Cambodia Cambodia |
19% | −$12B |
 Indonesia Indonesia |
19% | −$18B |
 Malaysia Malaysia |
19% | −$25B |
 Pakistan Pakistan |
19% | −$3B |
 Philippines Philippines |
19% | −$5B |
 Thailand Thailand |
19% | −$45B |
 Nicaragua Nicaragua |
18% | −$2B |
 Afghanistan Afghanistan |
15% | −$0.011B |
 Angola Angola |
15% | −$1B |
 Bolivia Bolivia |
15% | −$0.073B |
 Botswana Botswana |
15% | −$0.301B |
 Cameroon Cameroon |
15% | −$0.059B |
 Chad Chad |
15% | −$0.025B |
 Costa Rica Costa Rica |
15% | −$2B |
 Ivory Coast Ivory Coast |
15% | −$0.424B |
 DR Congo DR Congo |
15% | −$0.096B |
 Ecuador Ecuador |
15% | −$0.974B |
 Equatorial Guinea Equatorial Guinea |
15% | −$0.032B |
 EU (on most goods) EU (on most goods) |
15% | −$236B |
 Fiji Fiji |
15% | −$0.163B |
 Ghana Ghana |
15% | −$0.206B |
 Guyana Guyana |
15% | −$4B |
 Iceland Iceland |
15% | −$0.082B |
 Israel Israel |
15% | −$7B |
 Japan Japan |
15% | −$69B |
 Jordan Jordan |
15% | −$1B |
 Lesotho Lesotho |
15% | −$0.234B |
 Liechtenstein Liechtenstein |
15% | −$0.177B |
 Madagascar Madagascar |
15% | −$0.679B |
 Malawi Malawi |
15% | −$0.013B |
 Mauritius Mauritius |
15% | −$0.186B |
 Mozambique Mozambique |
15% | −$0.068B |
 Namibia Namibia |
15% | −$0.114B |
 Nauru Nauru |
15% | −$0.001B |
 New Zealand New Zealand |
15% | −$1B |
 Nigeria Nigeria |
15% | −$1B |
 North Macedonia North Macedonia |
15% | −$0.113B |
 Norway Norway |
15% | −$2B |
 Papua New Guinea Papua New Guinea |
15% | −$0.013B |
 South Korea South Korea |
15% | −$66B |
 Trinidad and Tobago Trinidad and Tobago |
15% | −$0.422B |
 Turkey Turkey |
15% | −$1B |
 Uganda Uganda |
15% | −$0.026B |
 Vanuatu Vanuatu |
15% | −$0.006B |
 Venezuela Venezuela |
15% | −$2B |
 Zambia Zambia |
15% | −$0.055B |
 Zimbabwe Zimbabwe |
15% | −$0.024B |
| All other countries | 10% | — |
North American Neighbors Hit Hard
At the beginning of the year, President Trump threatened to impose tariffs of 25% on Mexican imports and 35% on Canadian imports. He justified these threats as part of his strategy to curb illegal immigration, reduce the flow of fentanyl into the United States, and address the U.S. trade deficit with both countries.
On August 1, he raised tariffs to 35% on Canadian goods not covered by the United States–Mexico–Canada Agreement (USMCA), while Mexico received a 90-day extension before any increase takes effect. Since goods that meet USMCA rules of origin are exempt, the vast majority of Canadian exports—over 85–95%—still enter the U.S. duty-free.
Combined, the two countries accounted for over $230 billion in trade deficits with the U.S in 2024.
Learn More on the Voronoi App 
If you enjoyed today’s post, check out Visualizing the Major Holders of America’s Debt on Voronoi, the new app from Visual Capitalist.


