How Much Are Homes Worth Across the U.S. in 2026?
Key Takeaways
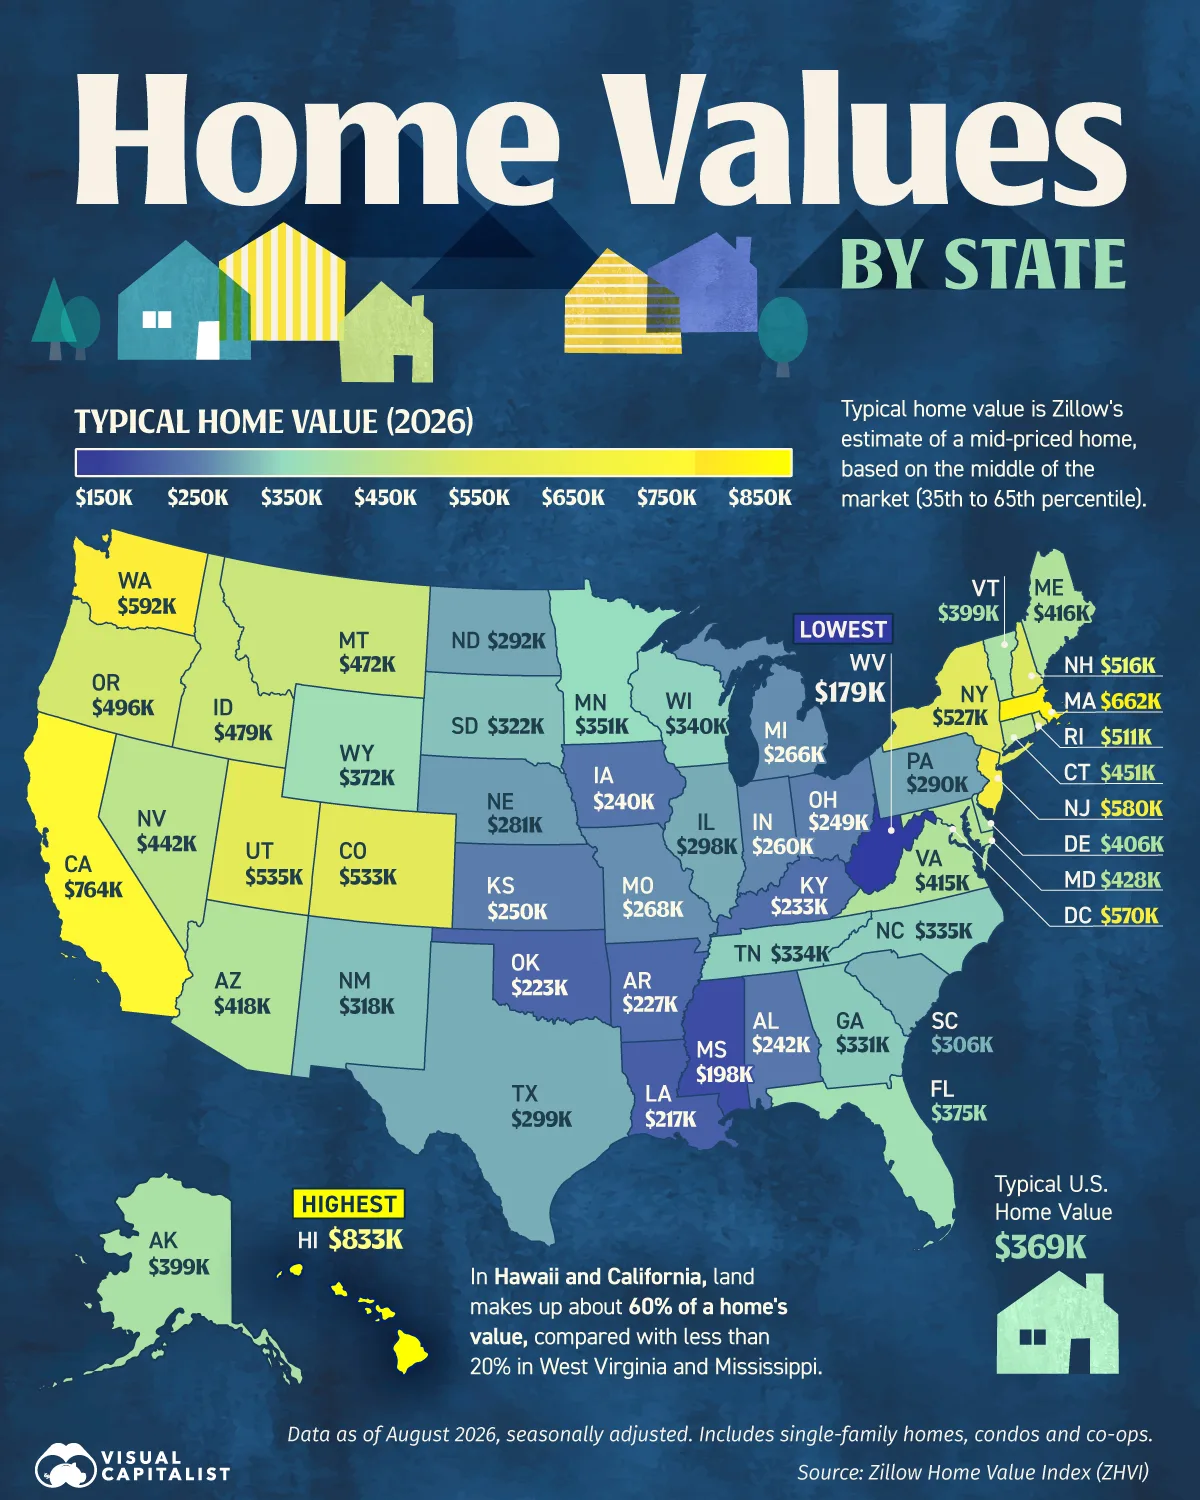
- A typical home in Hawaii is worth $833,000, about 4.6 times one in West Virginia ($179,000).
- Eight of the 10 most expensive states are on a coast, while all 10 of the least expensive are in the South and Midwest, each with typical values below $250,000.
- Land makes up about 60% of a home’s value in Hawaii and California, compared with less than 20% in West Virginia and Mississippi.
For most American families, a home is both their biggest purchase and their largest asset. But how much that home is worth depends heavily on where it sits.
Across the U.S., typical home values range from under $200,000 in the least expensive states to more than $750,000 in the priciest markets. Geography, housing supply, and demand all help explain the differences.
This graphic maps the typical home value in every U.S. state as of August 2026, using the Zillow Home Value Index, which estimates what a mid-priced home is worth.
Why Hawaii and California Have the Most Expensive Homes
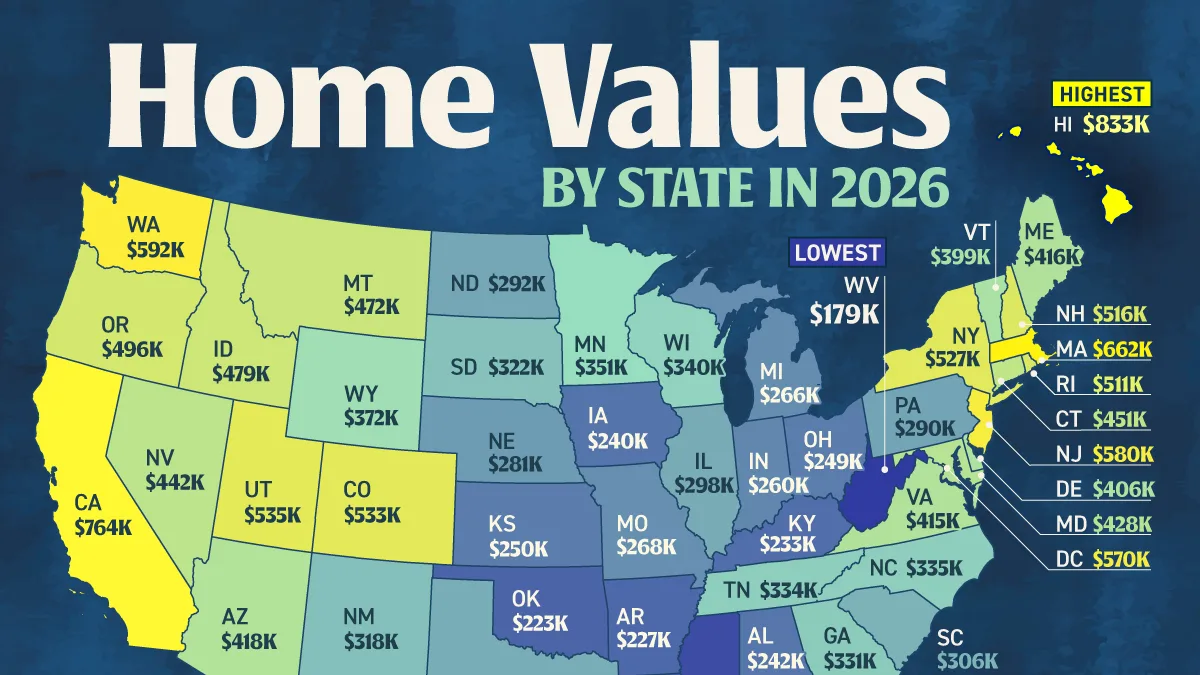
Ten states and D.C. have typical home values above $500,000. Eight of those states are on a coast, led by Hawaii ($833,000) and California ($764,000).
Land is a major reason. In Hawaii and California, land makes up about 60% of a home’s value, compared with 40% nationally, according to FHFA estimates for 2022. Oceans, mountains, and zoning rules constrain the supply of buildable land, while strong demand pushes up the price of each lot.
Among other populous states, a typical home is worth $527,000 in New York, compared with $375,000 in Florida and $299,000 in Texas.
The table below ranks all 50 states and D.C. by typical home value:
| Rank | State or District | Typical Home Value, USD (August 2026) |
|---|---|---|
| 1 | Hawaii | 833,340 |
| 2 | California | 764,158 |
| 3 | Massachusetts | 661,896 |
| 4 | Washington | 591,879 |
| 5 | New Jersey | 580,353 |
| 6 | District of Columbia | 570,119 |
| 7 | Utah | 534,582 |
| 8 | Colorado | 532,748 |
| 9 | New York | 526,714 |
| 10 | New Hampshire | 516,306 |
| 11 | Rhode Island | 511,233 |
| 12 | Oregon | 496,113 |
| 13 | Idaho | 478,744 |
| 14 | Montana | 471,746 |
| 15 | Connecticut | 450,873 |
| 16 | Nevada | 442,027 |
| 17 | Maryland | 428,308 |
| 18 | Arizona | 417,990 |
| 19 | Maine | 415,552 |
| 20 | Virginia | 414,662 |
| 21 | Delaware | 406,074 |
| 22 | Vermont | 399,053 |
| 23 | Alaska | 398,663 |
| 24 | Florida | 375,470 |
| 25 | Wyoming | 371,854 |
| 26 | Minnesota | 350,752 |
| 27 | Wisconsin | 339,699 |
| 28 | North Carolina | 334,773 |
| 29 | Tennessee | 334,108 |
| 30 | Georgia | 330,817 |
| 31 | South Dakota | 321,574 |
| 32 | New Mexico | 318,241 |
| 33 | South Carolina | 306,323 |
| 34 | Texas | 299,367 |
| 35 | Illinois | 297,573 |
| 36 | North Dakota | 292,293 |
| 37 | Pennsylvania | 290,401 |
| 38 | Nebraska | 280,673 |
| 39 | Missouri | 267,879 |
| 40 | Michigan | 266,292 |
| 41 | Indiana | 260,095 |
| 42 | Kansas | 249,603 |
| 43 | Ohio | 248,803 |
| 44 | Alabama | 241,613 |
| 45 | Iowa | 239,547 |
| 46 | Kentucky | 232,577 |
| 47 | Arkansas | 227,264 |
| 48 | Oklahoma | 223,261 |
| 49 | Louisiana | 217,039 |
| 50 | Mississippi | 197,606 |
| 51 | West Virginia | 179,496 |
| — |  United States (Average) United States (Average) |
368,697 |
Typical home value is Zillow’s estimate of a mid-priced home, based on homes between the 35th and 65th percentile of the market. Seasonally adjusted. Includes single-family homes, condos, and co-ops.
In nine of the 10 most expensive states, land accounts for more than 40% of a home’s value. Hawaii also builds slowly: obtaining a building permit takes more than three times as long as the national average, according to UHERO.
At the other end, West Virginia ($179,000) and Mississippi ($198,000) are among the least expensive states.
In the 10 least expensive states, land makes up less than a quarter of a home’s value, so prices are closer to what it costs to build the house itself. Those lower prices help explain why West Virginia has one of the highest shares of young homebuyers.
Home Values Are Falling Where America Built the Most
The most expensive housing markets aren’t necessarily seeing the fastest price growth.
Nationally, the typical home value rose 1.2% from August 2025 to August 2026, but values fell in D.C. and in 10 states. All those states are in the South and West, with the largest declines in Nevada (-1.8%), Texas (-1.6%), and Florida (-1.5%).
The table below ranks all 50 states and D.C. by the change in typical home value from August 2025 to August 2026, using Zillow data:
| Rank | State or District | Annual Home Value Change, August 2026 (%) |
|---|---|---|
| 1 | Alaska | 5.73 |
| 2 | New York | 5.56 |
| 3 | Illinois | 5.26 |
| 4 | North Dakota | 5.20 |
| 5 | Wisconsin | 5.09 |
| 6 | Connecticut | 5.04 |
| 7 | Michigan | 3.99 |
| 8 | New Jersey | 3.90 |
| 9 | Kansas | 3.84 |
| 10 | Arkansas | 3.60 |
| 11 | Iowa | 3.54 |
| 12 | Missouri | 3.49 |
| 13 | Rhode Island | 3.44 |
| 14 | Ohio | 3.35 |
| 15 | Nebraska | 3.12 |
| 16 | West Virginia | 3.06 |
| 17 | Indiana | 3.01 |
| 18 | New Hampshire | 2.92 |
| 19 | Oklahoma | 2.78 |
| 20 | South Dakota | 2.50 |
| 21 | Minnesota | 2.46 |
| 22 | Pennsylvania | 2.36 |
| 23 | Massachusetts | 2.31 |
| 24 | Mississippi | 2.29 |
| 25 | Virginia | 2.21 |
| 26 | Louisiana | 2.11 |
| 27 | Montana | 2.05 |
| 28 | Idaho | 2.00 |
| 29 | Alabama | 1.88 |
| 30 | New Mexico | 1.70 |
| 31 | Maine | 1.62 |
| 32 | Utah | 1.47 |
| 33 | Wyoming | 1.40 |
| 34 | Delaware | 1.26 |
| 35 | Hawaii | 1.11 |
| 36 | Vermont | 1.02 |
| 37 | South Carolina | 0.96 |
| 38 | Tennessee | 0.66 |
| 39 | California | 0.41 |
| 40 | Maryland | 0.02 |
| 41 | North Carolina | -0.03 |
| 42 | Oregon | -0.05 |
| 43 | Washington | -0.34 |
| 44 | Kentucky | -0.41 |
| 45 | Georgia | -0.55 |
| 46 | District of Columbia | -1.04 |
| 47 | Arizona | -1.14 |
| 48 | Colorado | -1.41 |
| 49 | Florida | -1.46 |
| 50 | Texas | -1.57 |
| 51 | Nevada | -1.83 |
| — | United States (Average) |
1.17 |
Seasonally adjusted, nominal home values. Percent changes are calculated from unrounded values and rounded to two decimal places. The U.S. benchmark is Zillow’s national series.
New housing supply helps explain the split. Florida, Arizona, and Texas permitted 38 to 41 new homes per 1,000 residents from 2021 to 2025, compared with 23 nationally, according to Census Bureau data.
More housing supply gives buyers greater choice, and Florida’s typical home is now worth 7.2% less than at its May 2024 peak, part of a broader cooling in Sun Belt markets.
By contrast, values rose fastest in several states with limited construction. Alaska, Illinois, and Connecticut permitted fewer than nine new homes per 1,000 residents over the same period, among the lowest rates in the country. Typical home values rose 5% or more in all three.
Learn More on the Voronoi App
If you enjoyed today’s post, check out Which States Issued the Most New Home Building Permits Per Capita on Voronoi.