Mapped: Where Americans Earn the Most Per Hour in 2026
See visuals like this from many other data creators on our Voronoi app. Download it for free on iOS or Android and discover incredible data-driven charts from a variety of trusted sources.
Key Takeaways
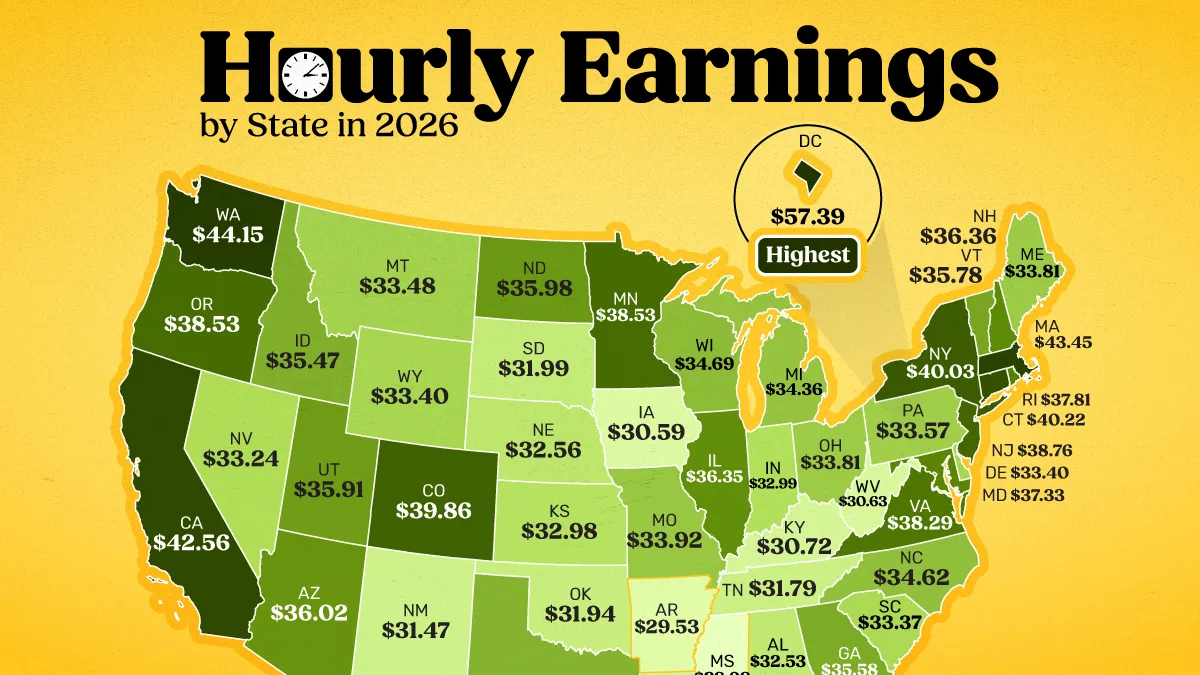
- Washington, D.C. leads the nation with average hourly earnings of $57.39, more than $13 per hour ahead of second-place Washington state.
- Only seven states report average hourly earnings above $40 per hour, with most clustered along the coasts.
- Mississippi ranks last at $28.98 per hour, highlighting the wide pay gap across U.S. labor markets.
From technology hubs to government centers, America’s highest-paying labor markets are concentrated in a relatively small number of states.
This ranking compares average hourly earnings across all 50 states and the District of Columbia, showing where workers earn the most per hour in 2026.
The data for this visualization comes from the Bureau of Labor Statistics and reflects average hourly earnings for private-sector employees as of April 2026.
Washington, D.C. Stands Alone
At $57.39 per hour, Washington, D.C. sits in a league of its own.
The district’s unique economy is heavily influenced by the federal government, supporting a vast ecosystem of contractors, consultants, defense firms, law offices, and technology companies.
| Rank | State/District | Average hourly earnings (2026) |
|---|---|---|
| 1 | District of Columbia | $57.39 |
| 2 | Washington | $44.15 |
| 3 | Massachusetts | $43.45 |
| 4 | California | $42.56 |
| 5 | Connecticut | $40.22 |
| 6 | Hawaii | $40.07 |
| 7 | New York | $40.03 |
| 8 | Colorado | $39.86 |
| 9 | New Jersey | $38.76 |
| 10 | Minnesota | $38.53 |
| 11 | Oregon | $38.53 |
| 12 | Alaska | $38.34 |
| 13 | Virginia | $38.29 |
| 14 | Rhode Island | $37.81 |
| 15 | Maryland | $37.33 |
| 16 | New Hampshire | $36.36 |
| 17 | Illinois | $36.35 |
| 18 | Arizona | $36.02 |
| 19 | North Dakota | $35.98 |
| 20 | Utah | $35.91 |
| 21 | Florida | $35.85 |
| 22 | Vermont | $35.78 |
| 23 | Georgia | $35.58 |
| 24 | Idaho | $35.47 |
| 25 | Texas | $34.85 |
| 26 | Wisconsin | $34.69 |
| 27 | North Carolina | $34.62 |
| 28 | Michigan | $34.36 |
| 29 | Missouri | $33.92 |
| 30 | Maine | $33.81 |
| 31 | Ohio | $33.81 |
| 32 | Pennsylvania | $33.57 |
| 33 | Montana | $33.48 |
| 34 | Delaware | $33.40 |
| 35 | Wyoming | $33.40 |
| 36 | South Carolina | $33.37 |
| 37 | Nevada | $33.24 |
| 38 | Indiana | $32.99 |
| 39 | Kansas | $32.98 |
| 40 | Nebraska | $32.56 |
| 41 | Alabama | $32.53 |
| 42 | South Dakota | $31.99 |
| 43 | Oklahoma | $31.94 |
| 44 | Tennessee | $31.79 |
| 45 | New Mexico | $31.47 |
| 46 | Louisiana | $30.84 |
| 47 | Kentucky | $30.72 |
| 48 | West Virginia | $30.63 |
| 49 | Iowa | $30.59 |
| 50 | Arkansas | $29.53 |
| 51 | Mississippi | $28.98 |
This concentration of highly educated workers and specialized industries helps push average earnings in D.C. far above the national norm.
D.C.’s lead over second-place Washington state exceeds $13 per hour, making it the only U.S. jurisdiction with average hourly earnings above $50.
Tech Hubs and Coastal States Lead the Rankings
Several of the highest-paying states are home to major technology and innovation centers.
Washington ($44.15), Massachusetts ($43.45), and California ($42.56) all rank among the top four thanks to strong technology, biotechnology, and professional services sectors.
Meanwhile, states such as Connecticut, New York, New Jersey, and Maryland benefit from proximity to financial centers and large concentrations of corporate headquarters.
The South and Appalachia Trail the National Leaders
Many of the lowest-ranked states are located in the South and Appalachia. Mississippi recorded the lowest average hourly earnings at $28.98, followed by Arkansas at $29.53 and Iowa at $30.59.
Lower wages in these states are often linked to industry composition, lower costs of living, and a smaller presence of high-paying sectors such as technology and finance.
However, many of these states continue to attract investment in manufacturing, logistics, and energy projects that could gradually reshape local labor markets.
Learn More on the Voronoi App 
If you enjoyed today’s post, check out The States Where Housing Prices Have Surged the Most (2021–2026) on Voronoi.