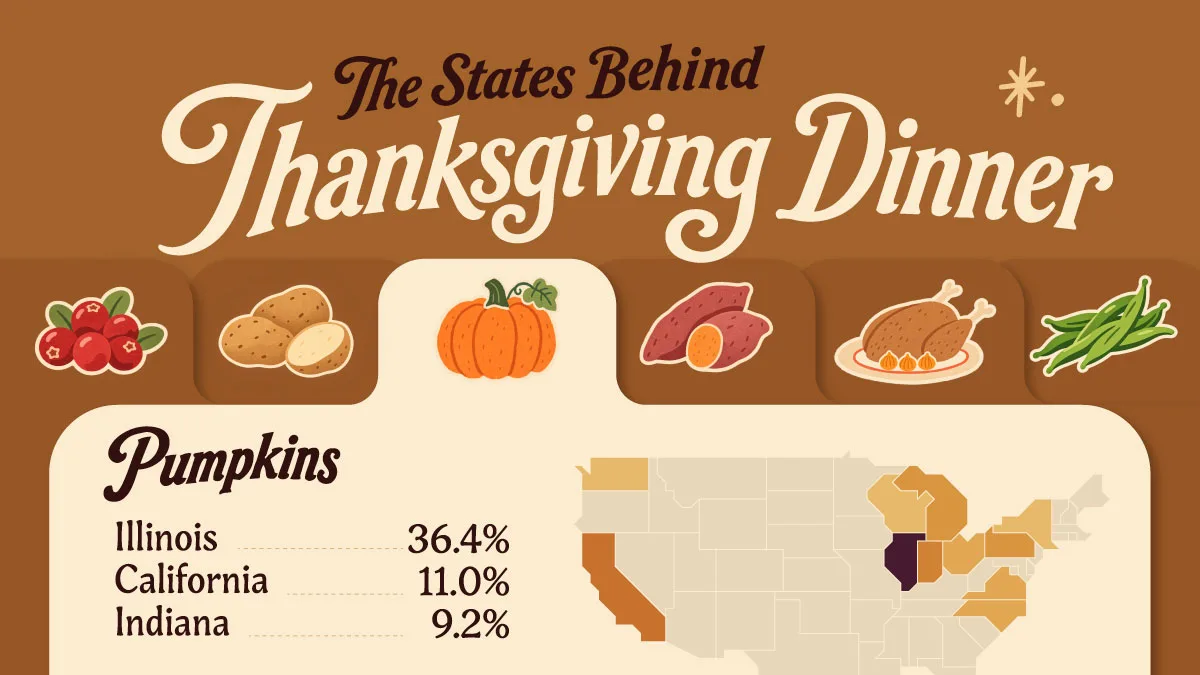
The States Behind America’s Thanksgiving Dinner
Key Takeaways
- North Carolina produces 58% of America’s sweet potatoes, more than every other state combined.
- Wisconsin accounts for 61.3% of U.S. cranberry production and also leads the country in green beans.
- Minnesota leads turkey production, while Illinois produces more than one-third of the nation’s pumpkins.
Thanksgiving dinner may be a nationwide tradition, but much of the food on the table comes from a surprisingly small number of states. From the turkey at the center of the meal to potatoes, cranberries, and pumpkin pie, different regions dominate different holiday staples.
This visualization uses 2025 annual production data from the USDA National Agricultural Statistics Service to map where six Thanksgiving foods are produced.
The figures show each state’s share of total U.S. production, rather than food sold specifically for Thanksgiving.
Where America’s Thanksgiving Food Comes From
Six Thanksgiving staples reveal distinct production patterns. While some foods are grown across several major agricultural states, others depend heavily on a single producer.
The table below shows which states lead production for each food, along with their share of the national total.
| Ingredient | Leading state | U.S. share |
|---|---|---|
| Turkeys | Minnesota | 17.3% |
| Pumpkins | Illinois | 36.4% |
| Sweet potatoes | North Carolina | 58.0% |
| Potatoes | Idaho | 33.5% |
| Cranberries | Wisconsin | 61.3% |
| Green beans | Wisconsin | 42.9% |
North Carolina Dominates Sweet Potato Production
North Carolina accounts for 58% of U.S. sweet potato production, giving it a commanding lead over California and Mississippi.
The state produces more than three times as many sweet potatoes as second-place California, which holds an 18.4% share. Mississippi contributes another 14.5%, while all remaining states combined account for just 9.1%.
| State | U.S. share |
|---|---|
| North Carolina | 58.0% |
| California | 18.4% |
| Mississippi | 14.5% |
| Other states | 9.1% |
Regular potatoes have a different production footprint. Idaho and Washington account for 33.5% and 21.8% of U.S. output, respectively, giving the two states a combined majority share.
Together, these figures show how two familiar Thanksgiving sides rely on different agricultural regions.
Wisconsin Supplies Multiple Thanksgiving Sides
While some states specialize in one Thanksgiving staple, Wisconsin stands out for its contributions across several.
The state produces 61.3% of U.S. cranberries, making it the country’s dominant supplier. Massachusetts contributes another 25.6%, leaving just 13.1% of national production to other states.
Wisconsin also accounts for 42.9% of green bean production, more than two and a half times Florida’s 16.6% share. It ranks third in potato production as well, at 7.0%.
| Ingredient | Wisconsin’s U.S. share | National rank |
|---|---|---|
| Cranberries | 61.3% | 1 |
| Green beans | 42.9% | 1 |
| Potatoes | 7.0% | 3 |
These figures make Wisconsin a particularly important producer of Thanksgiving side dishes, with leading roles in two crops and a significant contribution to a third.
Turkeys and Pumpkins Have Their Own Production Hubs
Thanksgiving’s centerpiece has a different production footprint. Minnesota leads turkey production with a 17.3% share, followed by North Carolina at 14.5% and Arkansas at 11.1%.
Together, these three states account for nearly 43% of U.S. turkey production, highlighting the importance of the Midwest and Southeast.
Pumpkin production is more concentrated in a single state. Illinois produces 36.4% of the national total, more than three times California’s 11.0% share. Indiana ranks third at 9.2%, reinforcing the Midwest’s importance to this crop.
However, the USDA figures include pumpkins grown for processing, fresh markets, and decorative purposes. Not all of this production ends up in Thanksgiving pies.
For a broader look at the country’s agricultural landscape, explore our map of the top agricultural commodity in every U.S. state.
Full State-by-State Thanksgiving Food Production
Beyond the leading producers, many other states contribute to America’s Thanksgiving food supply.
The searchable table below breaks down reported production shares across all six foods. Use it to find your state, see which Thanksgiving ingredients it produces, and compare its contribution with the country’s agricultural leaders.
| Ingredient | State / aggregate | Share of U.S. Production per Ingredient |
|---|---|---|
| Turkeys | Arkansas | 11.1% |
| Turkeys | California | 2.2% |
| Potatoes | California | 2.1% |
| Sweet potatoes | California | 18.4% |
| Pumpkins | California | 11.0% |
| Green beans (snap beans) | California | 4.5% |
| Potatoes | Colorado | 5.5% |
| Potatoes | Florida | 1.1% |
| Green beans (snap beans) | Florida | 16.6% |
| Green beans (snap beans) | Georgia | 3.7% |
| Potatoes | Idaho | 33.5% |
| Pumpkins | Illinois | 36.4% |
| Green beans (snap beans) | Illinois | 7.0% |
| Turkeys | Indiana | 10.3% |
| Pumpkins | Indiana | 9.2% |
| Turkeys | Iowa | 5.6% |
| Potatoes | Maine | 4.1% |
| Cranberries | Massachusetts | 25.6% |
| Turkeys | Michigan | 2.2% |
| Potatoes | Michigan | 4.9% |
| Pumpkins | Michigan | 7.8% |
| Green beans (snap beans) | Michigan | 6.9% |
| Turkeys | Minnesota | 17.3% |
| Potatoes | Minnesota | 4.1% |
| Sweet potatoes | Mississippi | 14.5% |
| Turkeys | Missouri | 7.6% |
| Potatoes | Nebraska | 2.3% |
| Cranberries | New Jersey | 6.0% |
| Pumpkins | New York | 3.1% |
| Green beans (snap beans) | New York | 6.8% |
| Turkeys | North Carolina | 14.5% |
| Sweet potatoes | North Carolina | 58.0% |
| Pumpkins | North Carolina | 3.9% |
| Potatoes | North Dakota | 5.8% |
| Turkeys | Ohio | 3.2% |
| Pumpkins | Ohio | 3.8% |
| Potatoes | Oregon | 6.2% |
| Cranberries | Oregon | 7.0% |
| Green beans (snap beans) | Oregon | 7.7% |
| Turkeys | Other states | 11.1% |
| Sweet potatoes | Other states | 9.1% |
| Pumpkins | Other states | 8.1% |
| Turkeys | Pennsylvania | 3.9% |
| Pumpkins | Pennsylvania | 7.2% |
| Green beans (snap beans) | Pennsylvania | 3.8% |
| Turkeys | South Dakota | 0.9% |
| Potatoes | Texas | 1.5% |
| Turkeys | Virginia | 7.9% |
| Pumpkins | Virginia | 4.7% |
| Potatoes | Washington | 21.8% |
| Pumpkins | Washington | 2.9% |
| Turkeys | West Virginia | 2.1% |
| Potatoes | Wisconsin | 7.0% |
| Cranberries | Wisconsin | 61.3% |
| Pumpkins | Wisconsin | 2.1% |
| Green beans (snap beans) | Wisconsin | 42.9% |
Note: The USDA does not report every state separately for every crop. Some production is grouped under “Other states,” while unavailable or withheld figures should not be interpreted as zero production.
Learn More on the Voronoi App
If you enjoyed this visualization, check out Charted: Calories in Holiday Drinks on the Voronoi app.