Mapped: Where Diesel Prices Have Surged Since the Iran War
This was originally posted on our Voronoi app. Download the app for free on iOS or Android and discover incredible data-driven charts from a variety of trusted sources.
Key Takeaways:
- Diesel prices have more than doubled in Laos (+149.7%) and Fiji (+110.1%) since the Iran war began.
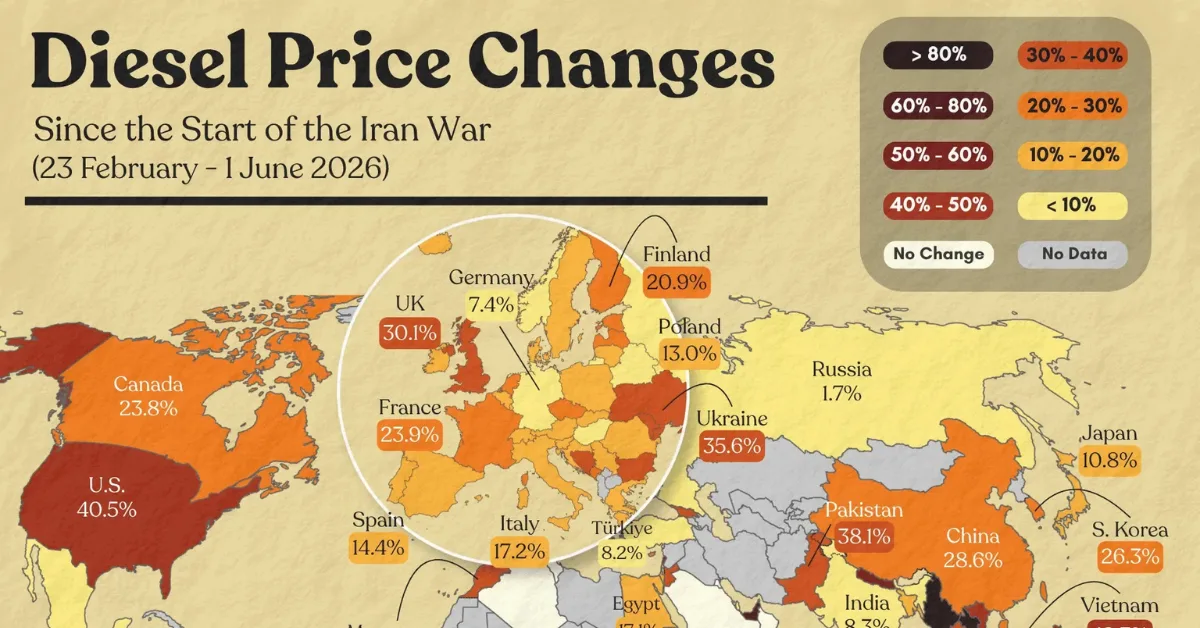
- Several major economies have seen sharp increases, including the U.S. (+40.5%), UK (+30.1%), China (+28.6%), and South Korea (+26.3%).
- Oil-producing countries such as Saudi Arabia, Kuwait, Oman, and Algeria recorded no diesel price growth, highlighting how domestic supply can shield consumers from global energy shocks.
Fuel markets have been under pressure since the start of the Iran war, as concerns over oil supply disruptions pushed energy prices higher.
This visualization by Iswardi Ishak, using data from Global Petrol Prices, shows how diesel prices changed between February 23 and June 1, revealing where the conflict’s impact on fuel markets has been felt most acutely.
Unlike gasoline, diesel is deeply tied to freight transportation, agriculture, manufacturing, and construction, making it an important indicator of broader economic pressures.
How Diesel Prices Have Changed Around the World
The table below shows diesel price changes for the 128 countries in the dataset:
| Rank | Country | Diesel Price Change (Feb 23-Jun 1) |
|---|---|---|
| 1 |  Laos Laos |
149.7% |
| 2 |  Fiji Fiji |
110.1% |
| 3 |  Burma (Myanmar) Burma (Myanmar) |
85.6% |
| 4 |  Lesotho Lesotho |
84.4% |
| 5 |  Indonesia Indonesia |
80.1% |
| 6 |  United Arab Emirates United Arab Emirates |
71.8% |
| 7 |  New Zealand New Zealand |
70.6% |
| 8 |  Peru Peru |
64.5% |
| 9 |  Malaysia Malaysia |
62.9% |
| 10 |  Tanzania Tanzania |
60.4% |
| 11 |  Nepal Nepal |
58.5% |
| 12 |  Curacao Curacao |
55.7% |
| 13 |  Lebanon Lebanon |
54.6% |
| 14 |  Singapore Singapore |
54.0% |
| 15 |  Chile Chile |
54.0% |
| 16 |  Honduras Honduras |
53.8% |
| 17 |  Panama Panama |
53.7% |
| 18 |  Mayotte Mayotte |
52.9% |
| 19 |  Vietnam Vietnam |
49.3% |
| 20 |  Sri Lanka Sri Lanka |
48.0% |
| 21 |  South Africa South Africa |
47.9% |
| 22 |  Philippines Philippines |
46.4% |
| 23 |  Puerto Rico Puerto Rico |
45.6% |
| 24 |  Mozambique Mozambique |
45.5% |
| 25 |  Namibia Namibia |
44.0% |
| 26 |  USA USA |
40.5% |
| 27 |  Sierra Leone Sierra Leone |
40.4% |
| 28 |  Kenya Kenya |
39.8% |
| 29 |  Georgia Georgia |
38.9% |
| 30 |  Pakistan Pakistan |
38.1% |
| 31 |  Zimbabwe Zimbabwe |
37.5% |
| 32 |  Grenada Grenada |
37.5% |
| 33 |  Bosnia and Herzegovina Bosnia and Herzegovina |
36.5% |
| 34 |  Ukraine Ukraine |
35.6% |
| 35 |  Malawi Malawi |
35.2% |
| 36 |  Bulgaria Bulgaria |
35.0% |
| 37 |  Moldova Moldova |
34.6% |
| 38 |  Aruba Aruba |
33.2% |
| 39 |  Morocco Morocco |
32.9% |
| 40 |  Thailand Thailand |
32.1% |
| 41 |  Cape Verde Cape Verde |
32.0% |
| 42 |  Jordan Jordan |
31.8% |
| 43 |  Paraguay Paraguay |
31.2% |
| 44 |  Zambia Zambia |
31.1% |
| 45 |  Costa Rica Costa Rica |
30.6% |
| 46 |  United Kingdom United Kingdom |
30.1% |
| 47 |  Cambodia Cambodia |
29.3% |
| 48 |  Cayman Islands Cayman Islands |
28.9% |
| 49 |  China China |
28.6% |
| 50 |  Cyprus Cyprus |
28.1% |
| 51 |  Andorra Andorra |
28.0% |
| 52 |  Ghana Ghana |
27.8% |
| 53 |  El Salvador El Salvador |
27.6% |
| 54 |  Australia Australia |
27.5% |
| 55 |  Jamaica Jamaica |
26.7% |
| 56 |  South Korea South Korea |
26.3% |
| 57 |  Macedonia Macedonia |
25.7% |
| 58 |  Guyana Guyana |
25.0% |
| 59 |  Montenegro Montenegro |
24.8% |
| 60 |  Argentina Argentina |
24.5% |
| 61 |  Netherlands Netherlands |
24.2% |
| 62 |  France France |
23.9% |
| 63 |  Canada Canada |
23.8% |
| 64 |  Czech Republic Czech Republic |
23.6% |
| 65 |  Hong Kong Hong Kong |
22.9% |
| 66 |  Estonia Estonia |
22.7% |
| 67 |  Guatemala Guatemala |
22.5% |
| 68 |  Latvia Latvia |
21.3% |
| 69 |  Mauritius Mauritius |
20.9% |
| 70 |  Finland Finland |
20.9% |
| 71 |  Liechtenstein Liechtenstein |
20.1% |
| 72 |  Croatia Croatia |
19.4% |
| 73 |  Lithuania Lithuania |
18.9% |
| 74 |  Austria Austria |
18.4% |
| 75 |  Switzerland Switzerland |
18.1% |
| 76 |  Luxembourg Luxembourg |
18.1% |
| 77 |  Uruguay Uruguay |
18.0% |
| 78 |  Suriname Suriname |
18.0% |
| 79 |  Belgium Belgium |
17.9% |
| 80 |  Iceland Iceland |
17.7% |
| 81 |  Slovakia Slovakia |
17.2% |
| 82 |  Italy Italy |
17.2% |
| 83 |  Egypt Egypt |
17.1% |
| 84 |  Portugal Portugal |
17.0% |
| 85 |  Sweden Sweden |
16.9% |
| 86 |  Romania Romania |
16.9% |
| 87 |  Denmark Denmark |
16.6% |
| 88 |  Taiwan Taiwan |
16.5% |
| 89 |  Rwanda Rwanda |
16.1% |
| 90 |  Dominican Republic Dominican Republic |
15.6% |
| 91 |  Ecuador Ecuador |
15.0% |
| 92 |  Bangladesh Bangladesh |
15.0% |
| 93 |  Bahrain Bahrain |
14.5% |
| 94 |  Spain Spain |
14.4% |
| 95 |  Brazil Brazil |
14.3% |
| 96 |  Poland Poland |
13.0% |
| 97 |  Israel Israel |
13.0% |
| 98 |  Slovenia Slovenia |
12.4% |
| 99 |  Greece Greece |
12.4% |
| 100 |  Serbia Serbia |
12.1% |
| 101 |  Ireland Ireland |
11.4% |
| 102 |  Japan Japan |
10.8% |
| 103 |  Wallis and Futuna Wallis and Futuna |
10.7% |
| 104 |  India India |
8.3% |
| 105 |  Turkey Turkey |
8.2% |
| 106 |  Qatar Qatar |
7.9% |
| 107 |  Germany Germany |
7.4% |
| 108 |  Hungary Hungary |
7.0% |
| 109 |  Benin Benin |
4.2% |
| 110 |  Ivory Coast Ivory Coast |
3.7% |
| 111 |  Mexico Mexico |
3.6% |
| 112 |  Colombia Colombia |
2.7% |
| 113 |  Belarus Belarus |
2.7% |
| 114 |  Russia Russia |
1.7% |
| 115 |  Norway Norway |
1.3% |
| 116 |  Tunisia Tunisia |
0.0% |
| 117 |  Saudi Arabia Saudi Arabia |
0.0% |
| 118 |  Saint Lucia Saint Lucia |
0.0% |
| 119 |  Oman Oman |
0.0% |
| 120 |  Nicaragua Nicaragua |
0.0% |
| 121 |  Malta Malta |
0.0% |
| 122 |  Madagascar Madagascar |
0.0% |
| 123 |  Kuwait Kuwait |
0.0% |
| 124 |  Cameroon Cameroon |
0.0% |
| 125 |  Burkina Faso Burkina Faso |
0.0% |
| 126 |  Bolivia Bolivia |
0.0% |
| 127 |  Algeria Algeria |
0.0% |
| 128 |  Barbados Barbados |
-1.2% |
The data highlights how differently countries have absorbed the shock. While diesel prices surged across much of Asia, Oceania, and parts of Africa, increases were generally more modest across several European economies. Government pricing policies, fuel subsidies, and domestic energy production all help explain these differences.
Meanwhile, several major oil-producing countries, including Saudi Arabia, Kuwait, Oman, and Algeria, recorded no diesel price growth, underscoring how domestic production and government fuel pricing policies can insulate consumers from global shocks.
The Countries Hit Hardest by Diesel Inflation
The steepest diesel price increases were concentrated in a diverse group of fuel-importing economies. Laos tops the ranking with a 149.7% increase, followed by Fiji (+110.1%), Myanmar (+85.6%), and Lesotho (+84.4%).
A number of countries also recorded increases above 60%, including Indonesia, the United Arab Emirates, New Zealand, Peru, Malaysia, and Tanzania. These gains far exceeded the increases seen across most advanced economies and underscore how global energy shocks can affect countries very differently.
How Does This Compare to Gasoline Prices?
The diesel surge mirrors trends seen in gasoline markets since the conflict began. In the United States, gasoline prices rose roughly 50% from pre-war levels during the sharpest phase of the crisis, according to reporting from PBS and NBC News.
However, some analysts note that gasoline prices have recently begun easing as crude oil markets adjust and fears of major supply disruptions have moderated. Yahoo Finance reports that falling oil prices and improving market sentiment have helped pull fuel prices off their highs, though prices remain elevated relative to pre-war levels.
The contrast illustrates a familiar pattern in energy markets: prices can rise rapidly when geopolitical risks emerge but often take longer to normalize once those risks fade.
Why Diesel Matters for the Broader Economy
Diesel is often viewed as a leading indicator of economic cost pressures because it powers much of the world’s freight network. When diesel prices rise, transportation becomes more expensive, increasing costs for manufacturers, retailers, farmers, and construction firms. Those higher costs can eventually filter through to consumers in the form of broader inflation.
In that vein, Reuters found that higher fuel costs are increasing expenses for American farmers, while economists have warned that sustained energy inflation could place additional pressure on consumer prices. Similar concerns have emerged across Europe and Asia as businesses absorb higher transportation and operating costs.
This helps explain why investors continue to closely monitor developments in the Middle East. Even small changes in global oil flows can have outsized effects on fuel prices, transportation costs, and economic growth.
Learn More on the Voronoi App 
If you enjoyed this post, check out How Much Does Everyone Pay for Gas Around the Globe? on the Voronoi app to compare fuel prices across countries and see where drivers pay the most, and least, at the pump.
- Source: https://www.visualcapitalist.com/cp/mapped-where-diesel-prices-have-surged-since-the-iran-war/