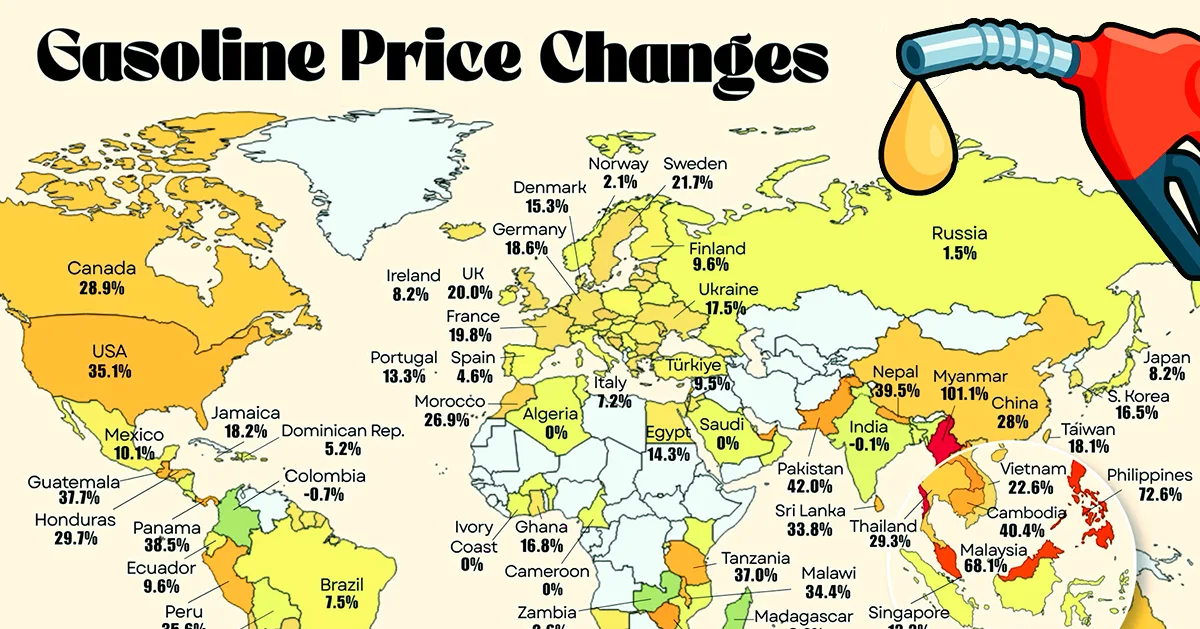
Mapped: Where Gas Prices Have Surged Over 100%
This was originally posted on our Voronoi app. Download the app for free on iOS or Android and discover incredible data-driven charts from a variety of trusted sources.
Key Takeaways
- Gas prices have surged dramatically worldwide, led by Myanmar (+101%).
- Southeast Asia dominates the rankings, with 5 of the top 10 largest increases.
- Major economies like the U.S. have also seen sharp rises, with prices up 35%.
- Fuel price spikes are beginning to push up fertilizer and food costs globally.
Gasoline prices are rising worldwide, but in some countries the increase has been extreme. In the hardest-hit countries, fuel costs have more than doubled in just a few weeks, underscoring how sharply energy markets can react to geopolitical shocks.
This map, created by Iswardi Ishak using data from Global Petrol Prices, tracks changes in gasoline costs across 128 countries between February 23 and April 13, 2026, following the outbreak of the Iran conflict.
The sharpest increases are clustered in a handful of regions, particularly across Southeast Asia, where reliance on imported fuel has amplified the impact. If disruptions persist, these price pressures could continue to build, particularly in regions most dependent on imported fuel.
Where Gas Prices Are Rising the Fastest
The countries below have seen the steepest gasoline price increases since late February, with several experiencing rapid double-digit—and even triple-digit—growth.
Southeast Asia accounts for half of the top 10 largest gasoline price increases. Myanmar leads globally with a staggering 101% surge, followed by the Philippines and Malaysia.
| Rank | Location | Gasoline Price Changes (Feb 23–Apr 13, 2026) |
|---|---|---|
| 1 |  Myanmar Myanmar |
101.1% |
| 2 |  Philippines Philippines |
72.6% |
| 3 |  Malaysia Malaysia |
68.1% |
| 4 |  Laos Laos |
45.6% |
| 5 |  Zimbabwe Zimbabwe |
42.9% |
| 6 |  Pakistan Pakistan |
42.0% |
| 7 |  United Arab Emirates United Arab Emirates |
40.8% |
| 8 |  Cambodia Cambodia |
40.4% |
| 9 |  Nepal Nepal |
39.5% |
| 10 |  Panama Panama |
38.5% |
| 11 |  Guatemala Guatemala |
37.7% |
| 12 |  Tanzania Tanzania |
37.0% |
| 13 |  Peru Peru |
35.6% |
| 14 |  United States United States |
35.1% |
| 15 |  Malawi Malawi |
34.4% |
| 16 |  New Zealand New Zealand |
34.0% |
| 17 |  Sri Lanka Sri Lanka |
33.8% |
| 18 |  Lebanon Lebanon |
32.6% |
| 19 |  Lesotho Lesotho |
31.6% |
| 20 |  Puerto Rico Puerto Rico |
29.7% |
| 21 |  Honduras Honduras |
29.7% |
| 22 |  Thailand Thailand |
29.3% |
| 23 |  Australia Australia |
29.3% |
| 24 |  Canada Canada |
28.9% |
| 25 |  China China |
28.0% |
| 26 |  Morocco Morocco |
26.9% |
| 27 |  Czech Republic Czech Republic |
25.3% |
| 28 |  Moldova Moldova |
25.0% |
| 29 |  Chile Chile |
24.7% |
| 30 |  Bosnia and Herzegovina Bosnia and Herzegovina |
24.7% |
| 31 |  Andorra Andorra |
23.1% |
| 32 |  Sierra Leone Sierra Leone |
22.8% |
| 33 |  Vietnam Vietnam |
22.6% |
| 34 |  Lithuania Lithuania |
21.9% |
| 35 |  Sweden Sweden |
21.7% |
| 36 |  Argentina Argentina |
21.4% |
| 37 |  Bulgaria Bulgaria |
21.3% |
| 38 |  Paraguay Paraguay |
21.1% |
| 39 |  Estonia Estonia |
21.1% |
| 40 |  El Salvador El Salvador |
20.6% |
| 41 |  Belgium Belgium |
20.1% |
| 42 |  United Kingdom United Kingdom |
20.0% |
| 43 |  France France |
19.8% |
| 44 |  Mayotte Mayotte |
18.7% |
| 45 |  Greece Greece |
18.6% |
| 46 |  Germany Germany |
18.6% |
| 47 |  Jamaica Jamaica |
18.2% |
| 48 |  Taiwan Taiwan |
18.1% |
| 49 |  Latvia Latvia |
17.7% |
| 50 |  Ukraine Ukraine |
17.5% |
| 51 |  Ghana Ghana |
16.8% |
| 52 |  Georgia Georgia |
16.7% |
| 53 |  South Korea South Korea |
16.5% |
| 54 |  South Africa South Africa |
16.5% |
| 55 |  Netherlands Netherlands |
16.5% |
| 56 |  Israel Israel |
16.4% |
| 57 |  Iceland Iceland |
16.4% |
| 58 |  Aruba Aruba |
16.1% |
| 59 |  Luxembourg Luxembourg |
16.0% |
| 60 |  Jordan Jordan |
15.9% |
| 61 |  Rwanda Rwanda |
15.8% |
| 62 |  Liechtenstein Liechtenstein |
15.8% |
| 63 |  Cyprus Cyprus |
15.8% |
| 64 |  Denmark Denmark |
15.3% |
| 65 |  Curacao Curacao |
15.3% |
| 66 |  Cape Verde Cape Verde |
15.2% |
| 67 |  Fiji Fiji |
14.9% |
| 68 |  Croatia Croatia |
14.9% |
| 69 |  Egypt Egypt |
14.3% |
| 70 |  Guyana Guyana |
14.1% |
| 71 |  Austria Austria |
13.9% |
| 72 |  Suriname Suriname |
13.4% |
| 73 |  Singapore Singapore |
13.3% |
| 74 |  Portugal Portugal |
13.3% |
| 75 |  Slovakia Slovakia |
13.0% |
| 76 |  Slovenia Slovenia |
12.8% |
| 77 |  Namibia Namibia |
12.8% |
| 78 |  Grenada Grenada |
12.5% |
| 79 |  Romania Romania |
12.3% |
| 80 |  Switzerland Switzerland |
11.6% |
| 81 |  Macedonia Macedonia |
11.6% |
| 82 |  Montenegro Montenegro |
11.5% |
| 83 |  Qatar Qatar |
10.8% |
| 84 |  Mexico Mexico |
10.1% |
| 85 |  Finland Finland |
9.6% |
| 86 |  Ecuador Ecuador |
9.6% |
| 87 |  Cayman Islands Cayman Islands |
9.6% |
| 88 |  Turkey Turkey |
9.5% |
| 89 |  Hong Kong Hong Kong |
9.1% |
| 90 |  Japan Japan |
8.2% |
| 91 |  Ireland Ireland |
8.2% |
| 92 |  Bahrain Bahrain |
7.7% |
| 93 |  Brazil Brazil |
7.5% |
| 94 |  Italy Italy |
7.2% |
| 95 |  Poland Poland |
6.8% |
| 96 |  Serbia Serbia |
6.7% |
| 97 |  Hungary Hungary |
6.4% |
| 98 |  Uruguay Uruguay |
5.8% |
| 99 |  Dominican Republic Dominican Republic |
5.2% |
| 100 |  Spain Spain |
4.6% |
| 101 |  Indonesia Indonesia |
2.8% |
| 102 |  Belarus Belarus |
2.7% |
| 103 |  Norway Norway |
2.1% |
| 104 |  Russia Russia |
1.5% |
| 105 |  Costa Rica Costa Rica |
0.8% |
| 106 |  Wallis and Futuna Islands Wallis and Futuna Islands |
0.7% |
| 107 |  Tunisia Tunisia |
0.0% |
| 108 |  Saudi Arabia Saudi Arabia |
0.0% |
| 109 |  Saint Lucia Saint Lucia |
0.0% |
| 110 |  Oman Oman |
0.0% |
| 111 |  Nicaragua Nicaragua |
0.0% |
| 112 |  Mozambique Mozambique |
0.0% |
| 113 |  Mauritius Mauritius |
0.0% |
| 114 |  Malta Malta |
0.0% |
| 115 |  Kuwait Kuwait |
0.0% |
| 116 |  Kenya Kenya |
0.0% |
| 117 |  Côte d’Ivoire Côte d’Ivoire |
0.0% |
| 118 |  Cameroon Cameroon |
0.0% |
| 119 |  Burkina Faso Burkina Faso |
0.0% |
| 120 |  Bolivia Bolivia |
0.0% |
| 121 |  Benin Benin |
0.0% |
| 122 |  Bangladesh Bangladesh |
0.0% |
| 123 |  Algeria Algeria |
0.0% |
| 124 |  India India |
-0.1% |
| 125 |  Colombia Colombia |
-0.7% |
| 126 |  Barbados Barbados |
-1.1% |
| 127 |  Zambia Zambia |
-2.6% |
| 128 |  Madagascar Madagascar |
-3.9% |
Several Southeast Asian countries are posting increases above 40%, placing the region at the center of the global price surge.
This region’s vulnerability is closely tied to its reliance on oil imports flowing through the Strait of Hormuz—one of the world’s most critical chokepoints. Disruptions here can quickly ripple across Asian markets.
Compounding the issue, many Southeast Asian economies lack domestic energy buffers, making them especially sensitive to price volatility and shipping risks.
Africa’s Rising Cost Burden
While Southeast Asia dominates the rankings, several African nations—including Zimbabwe, Tanzania, and Malawi—are also seeing fuel prices climb more than 30%.
For these economies, higher gasoline prices translate directly into increased transportation and living costs. In regions where incomes are lower and energy imports are essential, these spikes can quickly strain households and businesses alike.
Southern and eastern Africa, in particular, are facing a dual challenge: rising fuel costs and limited infrastructure to cushion supply disruptions.
Energy Shock Spreads to Food Systems
The impact of rising gasoline prices extends well beyond the pump. Energy is a key input in fertilizer production, and higher oil and gas prices are already pushing fertilizer costs upward.
This creates a direct cost shock across global agriculture, raising production expenses and increasing the likelihood of higher food prices in the months ahead, especially in import-dependent economies.
Learn More on the Voronoi App 
For a closer look at how Europe is navigating this energy disruption, check out Europe’s Fuel Index: Tracking the Iran War Shock on the Voronoi app.