Mapped: Where Unemployment Is Rising Fastest in America
See visuals like this from many other data creators on our Voronoi app. Download it for free on iOS or Android and discover incredible data-driven charts from a variety of trusted sources.
Key Takeaways
- Unemployment has increased in more than half of U.S. states since January 2025, though changes vary widely across the country.
- Connecticut recorded the largest increase, while Florida also saw one of the sharpest rises as hiring cooled.
- The Midwest bucked the national trend, led by falling unemployment in Indiana and Ohio.
Labor markets are diverging across the United States.
Since January 2025, unemployment has risen in more than half of states, while key regional clusters have moved in the opposite direction.
Cooling housing markets have weighed on labor demand in Florida and Arizona. Meanwhile, parts of the Midwest have proved more resilient, supported by a diverse industrial base.
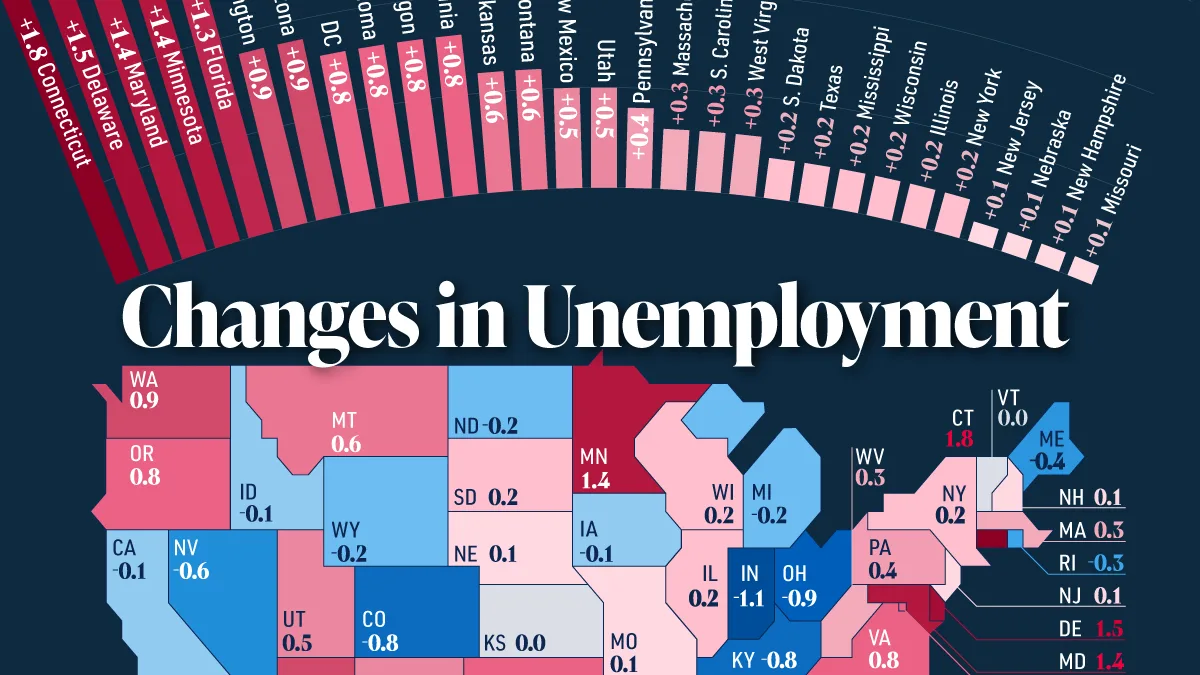
This map shows how unemployment rates changed across all 50 states and Washington, D.C. between January 2025 and May 2026, based on data from the U.S. Bureau of Labor Statistics.
Unemployment Changes by State
The table below ranks every state by the change in its unemployment rate since 2025.
| State or District | Unemployment Rate Jan 2025 |
Unemployment Rate May 2026 |
Change (Percentage Points) |
|---|---|---|---|
| Connecticut | 3.3% | 5.1% | +1.8 |
| Delaware | 3.6% | 5.1% | +1.5 |
| Maryland | 3.0% | 4.4% | +1.4 |
| Minnesota | 3.0% | 4.4% | +1.4 |
| Florida | 3.5% | 4.8% | +1.3 |
| Washington | 4.3% | 5.2% | +0.9 |
| Arizona | 3.9% | 4.8% | +0.9 |
| District of Columbia | 5.3% | 6.1% | +0.8 |
| Oklahoma | 3.3% | 4.1% | +0.8 |
| Oregon | 4.4% | 5.2% | +0.8 |
| Virginia | 3.0% | 3.8% | +0.8 |
| Arkansas | 3.6% | 4.2% | +0.6 |
| Montana | 2.8% | 3.4% | +0.6 |
| New Mexico | 4.4% | 4.9% | +0.5 |
| Utah | 3.2% | 3.7% | +0.5 |
| Pennsylvania | 3.8% | 4.2% | +0.4 |
| Massachusetts | 4.2% | 4.5% | +0.3 |
| South Carolina | 4.3% | 4.6% | +0.3 |
| West Virginia | 4.0% | 4.3% | +0.3 |
| South Dakota | 1.9% | 2.1% | +0.2 |
| Texas | 4.1% | 4.3% | +0.2 |
| Mississippi | 3.6% | 3.8% | +0.2 |
| Wisconsin | 3.2% | 3.4% | +0.2 |
| Illinois | 4.9% | 5.1% | +0.2 |
| New York | 4.4% | 4.6% | +0.2 |
| New Jersey | 4.6% | 4.7% | +0.1 |
| Nebraska | 2.9% | 3.0% | +0.1 |
| New Hampshire | 2.9% | 3.0% | +0.1 |
| Missouri | 3.7% | 3.8% | +0.1 |
| Kansas | 3.8% | 3.8% | +0.0 |
| Louisiana | 4.5% | 4.5% | +0.0 |
| North Carolina | 3.7% | 3.7% | +0.0 |
| Vermont | 2.6% | 2.6% | +0.0 |
| Iowa | 3.3% | 3.2% | -0.1 |
| Idaho | 3.8% | 3.7% | -0.1 |
| Tennessee | 3.7% | 3.6% | -0.1 |
| Alaska | 4.7% | 4.6% | -0.1 |
| California | 5.4% | 5.3% | -0.1 |
| Georgia | 3.6% | 3.4% | -0.2 |
| Michigan | 5.3% | 5.1% | -0.2 |
| North Dakota | 2.6% | 2.4% | -0.2 |
| Wyoming | 3.6% | 3.4% | -0.2 |
| Alabama | 3.3% | 3.0% | -0.3 |
| Rhode Island | 4.6% | 4.3% | -0.3 |
| Maine | 3.5% | 3.1% | -0.4 |
| Hawaii | 3.0% | 2.5% | -0.5 |
| Nevada | 5.8% | 5.2% | -0.6 |
| Kentucky | 5.3% | 4.5% | -0.8 |
| Colorado | 4.7% | 3.9% | -0.8 |
| Ohio | 4.6% | 3.7% | -0.9 |
| Indiana | 4.4% | 3.3% | -1.1 |
 U.S. Average U.S. Average |
4.0% | 4.3% | +0.3 |
Connecticut saw the sharpest increase in unemployment, with its jobless rate climbing 1.8 percentage points to 5.1% in May. Delaware, Maryland, and Minnesota followed, with each recording unemployment rates above the U.S. average of 4.3%.
California, meanwhile, saw unemployment edge slightly lower. Despite the improvement, its 5.3% jobless rate remained among the highest in the nation amid subdued hiring across the tech and entertainment sectors.
Why Some States Are Cooling Faster Than Others
The biggest increases weren’t concentrated in a single region, but several states tied to the post-pandemic growth boom are losing momentum.
Florida saw one of the largest jumps, with unemployment rising 1.3 percentage points over the period. Arizona and Washington also posted notable increases, while Texas saw unemployment edge up 0.2 percentage points.
Part of the shift reflects the same industries that powered growth in recent years. States lifted by rapid population growth, housing construction, tourism, and consumer spending are now more exposed as elevated interest rates weigh on real estate activity and households pull back on discretionary spending.
The Midwest Sees Momentum
The strongest labor market improvements weren’t found in the states with the biggest or fastest-growing economies. Instead, they were concentrated across the Midwest.
Indiana posted the nation’s largest decline in unemployment, followed by Ohio. Neighboring Kentucky and Michigan also recorded lower jobless rates, bucking the trend seen across much of the Sun Belt and Northeast.
The region has benefited from a broad industrial base, with advanced manufacturing, logistics, and healthcare helping support employment. Indiana has continued to see strength in pharmaceutical manufacturing, while Ohio has attracted billions in reshoring and advanced manufacturing investment.
Learn More on the Voronoi App 
To learn more about this topic, check out this graphic on the best college degrees for finding a job.